Constructing a Genetic Map with a Three-
To examine gene mapping with a three-
We will refer to these three loci as st, e, and ss, but keep in mind that either the recessive alleles (st, e, and ss) or the dominant alleles (st+, e+, and ss+) may be present at each locus. So, when we say that there are 10 m.u. between st and ss, we mean that there are 10 m.u. between the loci at which mutations st and ss occur; we could just as easily say that there are 10 m.u. between st+ and ss+.
To map these genes, we need to determine their order on the chromosome and the genetic distances between them. First, we must set up a three-
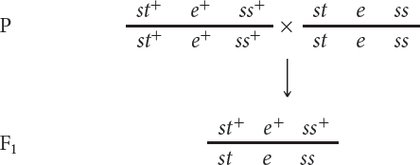
The order of the genes has been arbitrarily assigned because, at this point, we do not know which one is the middle gene. Additionally, the alleles in these heterozygotes are in coupling configuration (because all the wild-
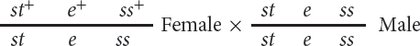
In the three-
131
The progeny produced by this cross are listed in Figure 5.12. For each locus, two classes of progeny are produced: progeny that are heterozygous, displaying the dominant trait, and progeny that are homozygous, displaying the recessive trait. With two classes of progeny possible for each of the three loci, there will be 23 = 8 classes of phenotypes possible in the progeny. In this example, all eight phenotypic classes are present, but in some three-
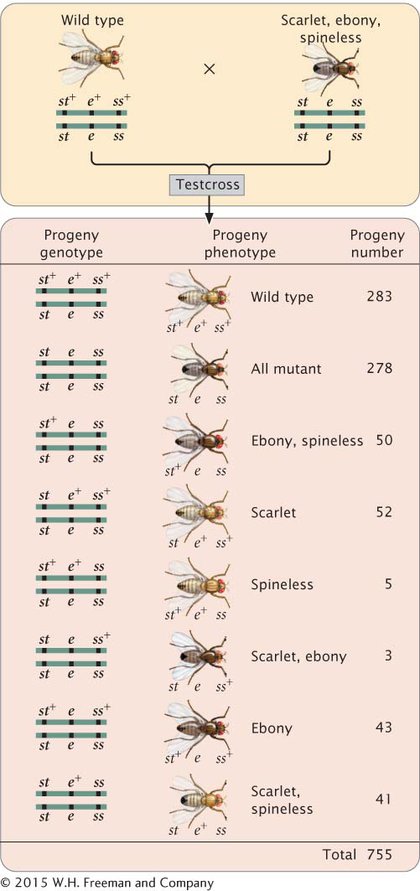
To map the genes, we need information about where and how often crossing over has taken place. In the homozygous recessive parent, the two alleles at each locus are the same, and so crossing over will have no effect on the types of gametes produced: with or without crossing over, all gametes from this parent have a chromosome with three recessive alleles (st e ss). In contrast, the heterozygous parent has different alleles on its two chromosomes, and so crossing over can be detected. The information that we need for mapping, therefore, comes entirely from the gametes produced by the heterozygous parent. Because chromosomes contributed by the homozygous parent carry only recessive alleles, whatever alleles are present on the chromosome contributed by the heterozygous parent will be expressed in the progeny.
As a shortcut, we often do not write out the complete genotypes of the testcross progeny, listing instead only the alleles expressed in the phenotype, which are the alleles inherited from the heterozygous parent. This convention is used in the discussion that follows.
CONCEPTS
To map genes, information about the location and number of crossovers in the gametes that produced the progeny of a cross is needed. An efficient way to obtain this information is to use a three-
 CONCEPT CHECK 4
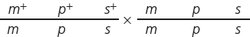
Write the genotypes of all recombinant and nonrecombinant progeny expected from the following three-

DETERMINING THE GENE ORDER The first task in mapping the genes is to determine their order on the chromosome. In Figure 5.12, we arbitrarily listed the loci in the order st, e, ss, but we had no way of knowing which of the three loci was between the other two. We can now identify the middle locus by examining the double-
First, determine which progeny are the nonrecombinants; they will be the two most numerous classes of progeny (even if crossing over takes place in every meiosis, the nonrecombinants will constitute at least 50% of the progeny). Among the progeny of the testcross in Figure 5.12, the most numerous are those with all three dominant traits (st+ e+ ss+) and those with all three recessive traits (st e ss).
132
Next, identify the double-
Three orders of genes on the chromosome are possible: the eye-
The only gene order that produces chromosomes with the set of alleles observed in the least numerous progeny—
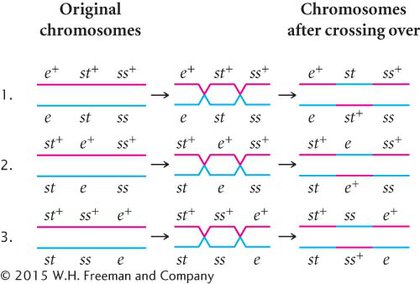
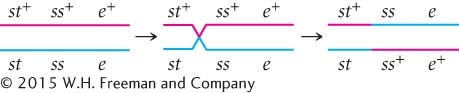
With a little practice, we can quickly determine which locus is in the middle without writing out all the gene orders. The phenotypes of the progeny are expressions of the alleles inherited from the heterozygous parent. Recall that when we looked at the results of double crossovers (see Figure 5.11), only the alleles at the middle locus differed from those in the nonrecombinants. If we compare the nonrecombinant progeny with the double-
Let’s compare the alleles in the double-
CONCEPTS
To determine the middle locus in a three-
CONCEPT CHECK 5
A three-
The c locus.
DETERMINING THE LOCATIONS OF CROSSOVERS When we know the correct order of the loci on the chromosome, we can rewrite the phenotypes of the testcross progeny in Figure 5.12 with the alleles in the correct order so that we can determine where crossovers have taken place (Figure 5.13).
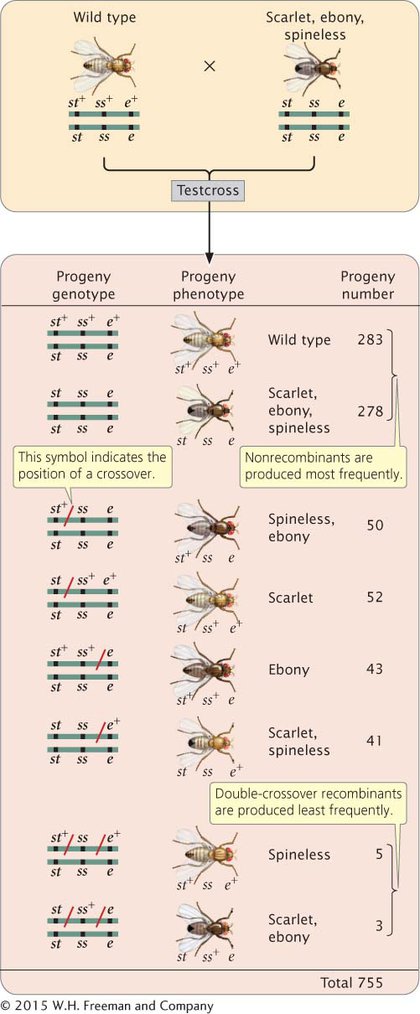
Among the eight classes of progeny, we have already identified two classes as nonrecombinants (st+ ss+ e+ and st ss e) and two classes as double crossovers (st+ ss e+ and st ss+ e). The other four classes include progeny that resulted from a chromosome that underwent a single crossover: two underwent single crossovers between st and ss, and two underwent single crossovers between ss and e.
To determine where the crossovers took place in these progeny, we can compare the alleles found in the single-
133
This same crossover also produces st ss+ e+ progeny.
This method can also be used to determine the location of crossing over in the other two types of single- chromosomes:
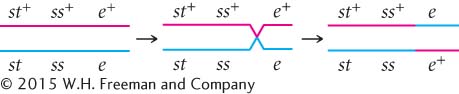
We now know the locations of all the crossovers. Their locations are marked with red slashes in Figure 5.13.
CALCULATING THE RECOMBINATION FREQUENCIES Next, we can determine the frequencies of recombination, which we will use to determine the map distances. We can calculate recombination frequency by adding up all of the recombinant progeny, dividing this number by the total number of progeny from the cross, and multiplying the number obtained by 100%. To determine the map distances accurately, we must include all crossovers (both single and double) that take place between two genes.
Recombinant progeny that possess a chromosome that underwent crossing over between the eye-
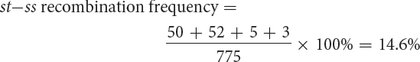
The distance between the st and ss loci can be expressed as 14.6 m.u.
The map distance between the bristle locus (ss) and the body locus (e) is determined in the same manner. The recombinant progeny that possess a crossover between ss and e are the single crossovers st+ ss+ / e and st ss / e+ and the double crossovers st+ / ss / e+ and st / ss+ / e. The recombination frequency is
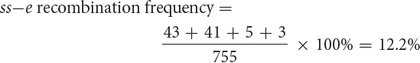
Thus, the map distance between ss and e is 12.2 m.u.
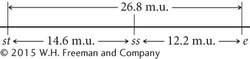
Finally, calculate the map distance between the outer two loci, st and e. This map distance can be obtained by summing the map distances between st and ss and between ss and e (14.6 m.u. + 12.2 m.u. = 26.8 m.u.). We can now use the map distances to draw a map of the three genes on the chromosome:
134
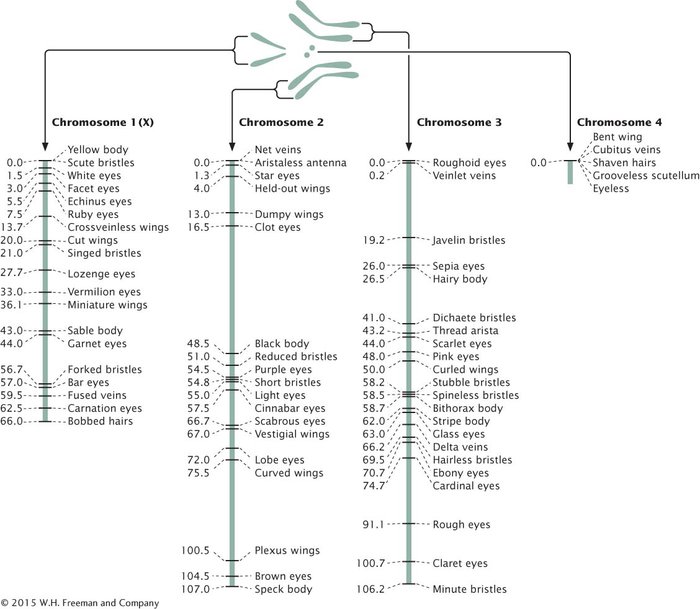
A genetic map of D. melanogaster is illustrated in Figure 5.14.
INTERFERENCE AND THE COEFFICIENT OF COINCIDENCE Map distances give us information not only about the distances that separate genes, but also about the proportions of recombinant and nonrecombinant gametes that will be produced in a cross. For example, knowing that genes st and ss on the third chromosome of D. melanogaster are separated by a distance of 14.6 m.u. tells us that 14.6% of the gametes produced by a fly heterozygous at these two loci will be recombinants. Similarly, 12.2% of the gametes from a fly heterozygous for ss and e will be recombinants.
Theoretically, we should be able to calculate the proportion of double-
135
This phenomenon is common in eukaryotic organisms. The calculation assumes that each crossover event is independent and that the occurrence of one crossover does not influence the occurrence of another. But crossovers are frequently not independent events: the occurrence of one crossover tends to inhibit additional crossovers in the same region of the chromosome, so double crossovers are less frequent than expected.
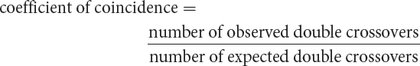
The degree to which one crossover interferes with additional crossovers in the same region is termed the interference. To calculate the interference, we first determine the coefficient of coincidence, which is the ratio of observed double crossovers to expected double crossovers:
For the loci that we mapped on the third chromosome of D. melanogaster (see Figure 5.13), we find
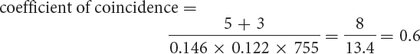
which indicates that we are actually observing only 60% of the double crossovers that we expected on the basis of the single-
interference = 1 − coefficient of coincidence
So the interference for our three-
interference = 1 − 0.6 = 0.4
This value of interference tells us that 40% of the double-
Sometimes a crossover increases the probability of another crossover taking place nearby and we see more double-
Most eukaryotic organisms exhibit interference, which causes crossovers to be more widely spaced along the chromosome than would be expected on a random basis. Interference was first observed in crosses of Drosophila in the early 1900s, yet despite years of study, the mechanism by which interference occurs is still not well understood. One proposed model of interference suggests that crossovers occur when stress builds up along the chromosome. Under this model, a crossover releases stress for some distance along the chromosome. Because a crossover relieves the stress that causes crossovers, additional crossovers are less likely to occur in the same area.  TRY PROBLEM 23
CONCEPTS
The coefficient of coincidence equals the number of double crossovers observed divided by the number of double crossovers expected on the basis of the single-
CONCEPT CHECK 6
In analyzing the results of a three-
Fewer double crossovers took place than expected on the basis of single-
crossover frequencies. More double crossovers took place than expected on the basis of single-
crossover frequencies. Fewer single crossovers took place than expected.
A crossover in one region interferes with additional crossovers in the same region.
b
CONNECTING CONCEPTS
Stepping Through the Three-
We have now examined the three-
Write out the phenotypes and numbers of progeny produced by the three-
point cross. The progeny phenotypes will be easier to interpret if you use allelic symbols for the traits (such as st+ e+ ss). Write out the genotypes of the original parents used to produce the triply heterozygous F1 individual in the testcross and, if known, the arrangement (coupling or repulsion) of the alleles on their chromosomes.
Determine which phenotypic classes among the progeny of the testcross are the nonrecombinants and which are the double crossovers. The nonrecombinants will be the two most common phenotypes; the double crossovers will be the two least common phenotypes.
Determine which locus lies in the middle. Compare the alleles present in the double crossovers with those present in the nonrecombinants; each class of double crossovers should be like one of the nonrecombinants for two loci and should differ for one locus. The locus that differs is the middle one.
Rewrite the phenotypes with the genes in correct order.
Determine where crossovers must have taken place to give rise to the progeny phenotypes. To do so, compare each phenotype with the phenotype of the nonrecombinant progeny.
136
Determine the recombination frequencies. Add the numbers of the progeny that possess a chromosome with a single crossover between a pair of loci. Add the double crossovers to this number. Divide this sum by the total number of progeny from the cross, and multiply by 100%; the result is the recombination frequency between the loci, which is the same as the map distance.
Draw a map of the three loci. Indicate which locus lies in the middle, and indicate the distances between them.
Determine the coefficient of coincidence and the interference. The coefficient of coincidence is the number of observed double-
crossover progeny divided by the number of expected double- crossover progeny. The expected number can be obtained by multiplying the product of the two single- recombination probabilities by the total number of progeny in the cross.
WORKED PROBLEM
In D. melanogaster, cherub wings (ch), black body (b), and cinnabar eyes (cn) result from recessive alleles that are all located on chromosome 2. A homozygous wild-
| ch | b+ | cn | 105 |
| ch+ | b+ | cn+ | 750 |
| ch+ | b | cn | 40 |
| ch+ | b+ | cn | 4 |
| ch | b | cn | 753 |
| ch | b+ | cn+ | 41 |
| ch+ | b | cn+ | 102 |
| ch | b | cn+ | 5 |
| Total | 1800 |
Determine the linear order of the genes on the chromosome (which gene is in the middle).
Calculate the map distances between the three loci.
Determine the coefficient of coincidence and the interference for these three loci.
Solution Strategy
What information is required in your answer to the problem?
The order of the genes on the chromosome, the map distances among the genes, the coefficient of coincidence, and the interference.
What information is provided to solve the problem?
A homozygous wild-
type fly was mated with a cherub, black, cinnabar fly, and the resulting F1 females were test- crossed with cherub, black, cinnabar males. The numbers of the different types of flies appearing among the progeny of the testcross.
Solution Steps
We can represent the crosses in this problem as follows:
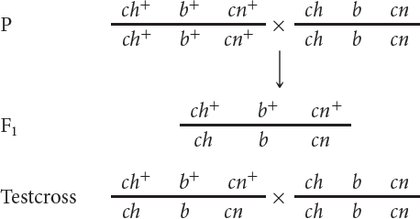
Note that at this point we do not know the order of the genes; we have arbitrarily put b in the middle.
The next step is to determine which of the testcross progeny are nonrecombinants and which are double crossovers. The nonrecombinants should be the most frequent phenotype, so they must be the progeny with phenotypes encoded by ch+ b+ cn+ and ch b cn. These genotypes are consistent with the genotypes of the parents, given earlier. The double crossovers are the least frequent phenotypes and are encoded by ch+ b+ cn and ch b cn+.
We can determine the gene order by comparing the alleles present in the double crossovers with those present in the nonrecombinants. The double-
crossover progeny should be like one of the nonrecombinants at two loci and unlike it at one locus; the allele that differs should be in the middle. Compare the double- crossover progeny ch b cn+ with the nonrecombinant ch b cn. Both have cherub wings (ch) and black body (b), but the double- crossover progeny have wild- type eyes (cn+), whereas the nonrecombinants have cinnabar eyes (cn). The locus that determines cinnabar eyes must be in the middle. To calculate the recombination frequencies among the genes, we first write the phenotypes of the progeny with the genes encoding them in the correct order. We have already identified the nonrecombinant and double-
crossover progeny, so the other four progeny types must have resulted from single crossovers. To determine where single crossovers took place, we compare the alleles found in the single- crossover progeny with those in the nonrecombinants. Crossing over must have taken place where the alleles switch from those found in one nonrecombinant to those found in the other nonrecombinant. The locations of the crossovers are indicated with a slash: 137
ch cn / b+ 105 single crossover ch+ cn+ b+ 750 nonrecombinant ch+ / cn b 40 single crossover ch+ / cn / b+ 4 double crossover ch cn b 753 nonrecombinant ch / cn+ b+ 41 single crossover ch+ cn+ / b 102 single crossover ch / cn+ / b 5 double crossover Total 1800 Next, we determine the recombination frequencies and draw a genetic map:
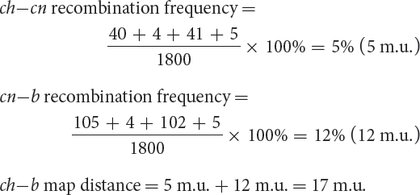
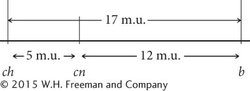
The coefficient of coincidence is the number of observed double crossovers divided by the number of expected double crossovers. The number of expected double crossovers is obtained by multiplying the probability of a crossover between ch and cn (0.05) × the probability of a crossover between cn and b (0.12) × the total number of progeny in the cross (1800):

Finally, the interference is equal to 1 – the coefficient of coincidence:
interference = 1 − 0.83 = 0.17
 To increase your skill with three-