Chromosome Morphology
Each functional eukaryotic chromosome has a centromere, to which spindle microtubules attach, and two telomeres, which stabilize the chromosome ends (see Figure 2.6). Chromosomes are classified into four basic types (see Figure 2.7):
Metacentric. The centromere is located approximately in the middle, so the chromosome has two arms of equal length.
Submetacentric. The centromere is displaced toward one end, creating a long arm and a short arm. (On human chromosomes, the short arm is designated by the letter p and the long arm by the letter q.)
Acrocentric. The centromere is near one end, producing a long arm and a knob, or satellite, at the other end.
Telocentric. The centromere is at or very near the end of the chromosome.
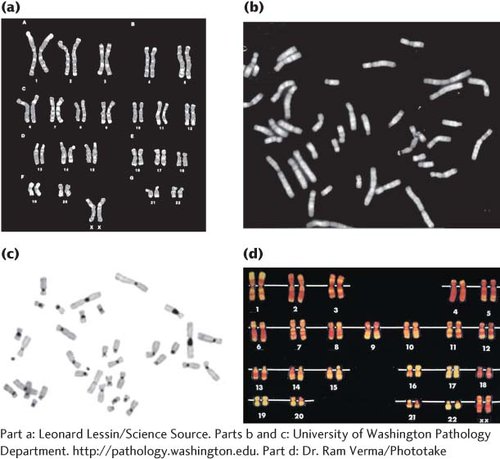
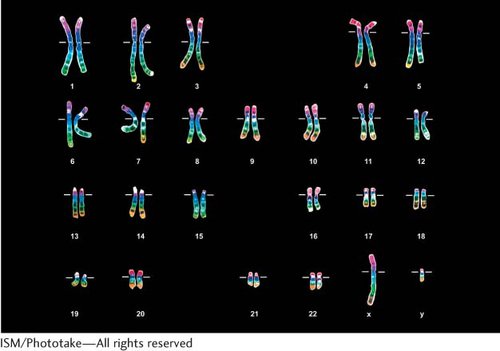
The complete set of chromosomes possessed by an organism is called its karyotype. An organism's karyotype is usually presented as a picture of metaphase chromosomes lined up in descending order of their size (Figure 6.1). Karyotypes are prepared from actively dividing cells, such as white blood cells, bone-
Preparation and staining techniques help to distinguish among chromosomes of similar size and shape. For instance, special preparation and staining of chromosomes with a dye called Giemsa reveals G bands (Figure 6.2a), which distinguish areas of DNA that are rich in adenine–thymine (A–T) base pairs (see Chapter 8). Q bands (Figure 6.2b) are revealed by staining chromosomes with quinacrine mustard and viewing the chromosomes under ultraviolet light; variation in the brightness of Q bands results from differences in the relative amounts of cytosine–guanine (C–G) and adenine–thymine base pairs. Other techniques reveal C bands (Figure 6.2c), which are regions of DNA occupied by centromeric heterochromatin, and R bands (Figure 6.2d), which are rich in cytosine–guanine base pairs.
151