Gene Mapping in Phages
The mapping of genes in bacteriophages themselves depends on homologous recombination between phage chromosomes and therefore requires the application of the same principles that are applied to mapping genes in eukaryotic organisms (see Chapter 5). Crosses are made between viruses that differ in two or more genes, and recombinant progeny phages are identified and counted. The proportion of recombinant progeny is then used to estimate the distances between the genes and their linear order on the chromosome.
In 1949, Alfred Hershey and Raquel Rotman examined rates of recombination in the T2 bacteriophage, which has single-
Hershey and Rotman crossed the h+ r− and h− r+ strains of T2 by infecting type B E. coli cells with a mixture of the two strains. They used a high concentration of phages so that most cells could be simultaneously infected by both strains (Figure 7.25). Within the bacterial cells, homologous recombination occasionally took place between the chromosomes of the different bacteriophage strains, producing h+ r+ and h− r− chromosomes, which were then packaged into new phage particles. When the cells lysed, the recombinant phages were released, along with the nonrecombinant h+ r− phages and h− r+ phages.
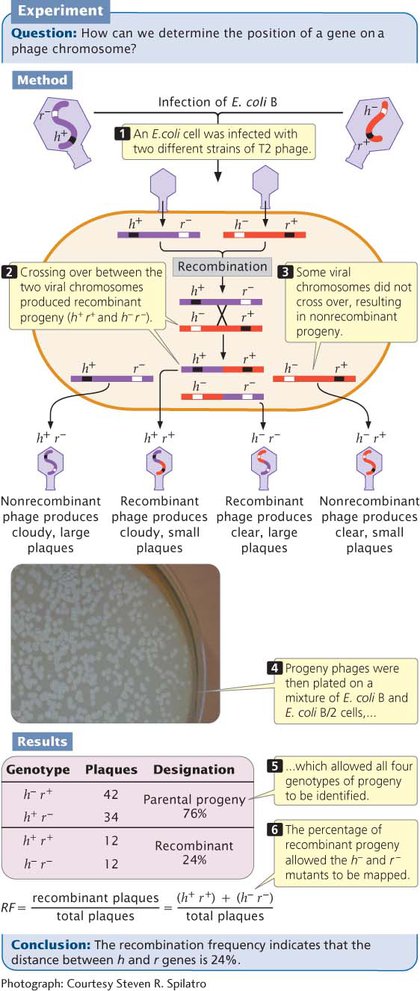
Hershey and Rotman diluted the progeny phages and plated them on a bacterial lawn that consisted of a mixture of B and B/2 cells. Phages carrying the h+ allele (which conferred the ability to infect only B cells) produced a cloudy plaque because the B/2 cells were not lysed. Phages carrying the h− allele produced a clear plaque because all the cells within the plaque were lysed. The r+ phages produced small plaques, whereas the r− phages produced large plaques. The genotypes of these progeny phages could therefore be determined by the appearance of the plaque (see Figure 7.25 and Table 7.4).
| Phenotype | Genotype |
|---|---|
| Clear and small | h− r+ |
| Cloudy and large | h+ r− |
| Cloudy and small | h+ r+ |
| Clear and large | h− r− |
198
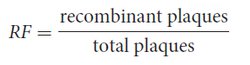
In this type of phage cross, the recombination frequency (RF) between the two genes can be calculated by using the following formula:
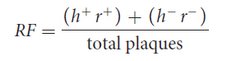
In Hershey and Rotman’s cross, the recombinant plaques were h+ r+ and h− r−; so the recombination frequency was
Recombination frequencies can be used to determine the distances between genes and their order on the phage chromosome, just as recombination frequencies are used to map genes in eukaryotes. In the 1950s and 1960s, Seymour Benzer used this method of analyzing recombination frequencies to map the locations of thousands of rII mutations in the T4 bacteriophage, providing the first detailed look at the structure of an individual gene.  TRY PROBLEM 21
CONCEPTS
To map phage genes, bacterial cells are infected with viruses that differ in two or more genes. Recombinant plaques are counted, and rates of recombination are used to determine the linear order of the genes on the chromosome and the distances between them.