APPLICATION QUESTIONS AND PROBLEMS
Introduction
Question 12
*12.Suppose that you want to compare the species of bacteria found in a polluted stream with the species found in an unpolluted stream. Traditionally, bacteria have been identified by growing them in the laboratory and comparing their physical and biochemical properties. You recognize that you will be unable to culture most of the bacteria that reside in the streams. How might you go about identifying the species in the two streams without culturing them in the laboratory?
Section 7.2
Question 13
*13.John Smith is a pig farmer. For the past five years, Smith has been adding vitamins and low doses of antibiotics to his pig food; he says that these supplements enhance the growth of the pigs. Within the past year, however, several of his pigs died from infections of common bacteria, which failed to respond to large doses of antibiotics. Can you explain the increased rate of mortality due to infection in Smith’s pigs? What advice might you offer Smith to prevent this problem in the future?
Question 14
14.In Figure 7.8, what do the red and blue parts of the DNA labeled by balloon 6 represent?
Question 15
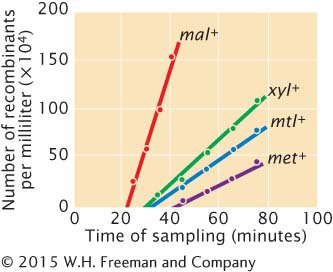
*15. Austin Taylor and Edward Adelberg isolated some new strains of Hfr cells that they then used to map several genes in E. coli by using interrupted conjugation (A. L. Taylor and E. A. Adelberg. 1960. Genetics 45:1233–1243). In one experiment, they mixed cells of Hfr strain AB-
Question 16
16.DNA from a strain of Bacillus subtilis with genotype a+ b+ c+ d+ e+ is used to transform a strain with genotype a− b− c− d− e−. Pairs of genes are checked for cotransformation, and the following results are obtained:
| Pair of genes | Cotransformation | Pair of genes | Cotransformation |
|---|---|---|---|
| a+ and b+ | No | b+ and d+ | No |
| a+ and c+ | No | b+ and e+ | Yes |
| a+ and d+ | Yes | c+ and d+ | No |
| a+ and e+ | Yes | c+ and e+ | Yes |
| b+ and c+ | Yes | d+ and e+ | No |
On the basis of these results, what is the order of the genes on the bacterial chromosome?
205
Question 17
17.DNA from a bacterial strain that is his+ leu+ lac+ is used to transform a strain that is his− leu− lac−. The following percentages of cells are transformed:
| Donor strain | Recipient strain | Genotype of transformed cells | Percentage of all cells |
|---|---|---|---|
| his+ leu+ lac+ | his− leu− lac− | his+ leu+ lac+ | 0.02 |
| his+ leu+ lac− | 0.00 | ||
| his+ leu− lac+ | 2.00 | ||
| his+ leu− lac− | 4.00 | ||
| his− leu+ lac+ | 0.10 | ||
| his− leu− lac+ | 3.00 | ||
| his− leu+ lac− | 1.50 |
What conclusions can you draw about the order of these three genes on the chromosome?
Which two genes are closest?
Question 18
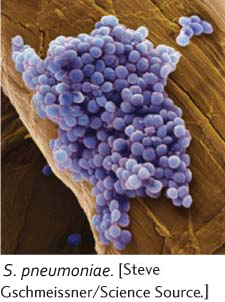
*18. Rollin Hotchkiss and Julius Marmur studied transformation in the bacterium Streptococcus pneumoniae (R. D. Hotchkiss and J. Marmur. 1954. Proceedings of the National Academy of Sciences of the United States of America 40:55–60). They examined four mutations in this bacterium: penicillin resistance (P), streptomycin resistance (S), sulfanilamide resistance (F), and the ability to utilize mannitol (M). They extracted DNA from strains of bacteria with different combinations of different mutations and used this DNA to transform wild-
| Donor DNA | Recipient DNA | Transformants | Percentage of all cells |
|---|---|---|---|
| M S F | M+ S+ F+ | M+ S F+ | 4.0 |
| M+ S+ F | 4.0 | ||
| M S+ F+ | 2.6 | ||
| M S F+ | 0.41 | ||
| M+ S F | 0.22 | ||
| M S+ F | 0.0058 | ||
| M S F | 0.0071 |
Hotchkiss and Marmur noted that the percentage of cotransformation was higher than would be expected on a random basis. For example, the results show that the 2.6% of the cells were transformed into M and 4% were transformed into S. If the M and S traits were inherited independently, the expected probability of cotransformation of M and S (M S) would be 0.026 × 0.04 = 0.001, or 0.1%. However, they observed 0.41% M S cotransformants, four times more than they expected. What accounts for the relatively high frequency of cotransformation of the traits they observed?
On the basis of the results, what conclusion can you draw about the order of the M, S, and F genes on the bacterial chromosome?
Why is the rate of cotransformation for all three genes (M S F) almost the same as that of the cotransformation of M F alone?
Section 7.3
Question 19
*19.Two mutations that affect plaque morphology in phages (a− and b−) have been isolated. Phages carrying both mutations (a− b−) are mixed with wild-
| Plaque phenotype | Number |
|---|---|
| a+ b+ | 2043 |
| a+ b− | 320 |
| a− b+ | 357 |
| a− b− | 2134 |
What is the frequency of recombination between the a and b genes?
Question 20
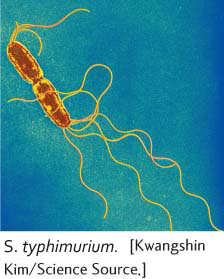
*20. T. Miyake and M. Demerec examined proline-
206
| Donor genotype | Transductant genotype | Number |
|---|---|---|
| proC+ proA− proB+ proD+ | proC+ proA+ proB+ proD+ | 2765 |
| proC+ proA+ proB− proD+ | 3 | |
| proC+ proA− proB+ proD+ | proC+ proA+ proB+ proD+ | 1838 |
| proC+ proA+ proB− proD+ | 2 | |
| proC+ proA+ proB+ proD− | proC+ proA+ proB+ proD+ | 1166 |
| proC+ proA+ proB+ proD− | 0 |
Why are there no proC− genotypes among the transductants?
Which genotypes represent single transductants and which represent cotransductants?
Is there evidence that proA, proB, and proD are located close to proC? Explain your answer.
Question 21
*21.A geneticist isolates two mutations in a bacteriophage. One mutation causes clear plaques (c), and the other produces minute plaques (m). Previous mapping experiments have established that the genes responsible for these two mutations are 8 m.u. apart. The geneticist mixes phages with genotype c+ m+ and genotype c− m− and uses the mixture to infect bacterial cells. She collects the progeny phages and cultures a sample of them on plated bacteria. A total of 1000 plaques are observed. What numbers of the different types of plaques (c+ m+, c− m−, c+ m−, c− m+) should she expect to see?
Question 22
*22.E. coli cells are simultaneously infected with two strains of phage λ. One strain has a mutant host range, is temperature sensitive, and produces clear plaques (genotype h st c); another strain carries the wild-
| Progeny phage genotype | Number of plaques |
|---|---|
| h+ c+ st+ | 321 |
| h c st | 338 |
| h+ c st | 26 |
| h c+ st+ | 30 |
| h+ c st+ | 106 |
| h c+ st | 110 |
| h+ c+ st | 5 |
| h c st+ | 6 |
Determine the order of the three genes on the phage chromosome.
Determine the map distances between the genes.
Determine the coefficient of coincidence and the interference (Chapter 5).
Question 23
23.A donor strain of bacteria with alleles a+ b+ c+ is infected with phages to map the donor chromosome using generalized transduction. The phage lysate from the bacterial cells is collected and used to infect a second strain of bacteria that are a– b– c−. Bacteria with the a+ gene are selected, and the percentages of cells with cotransduced b+ and c+ genes are recorded.
| Donor | Recipient | Selected gene | Cells with cotransduced gene (%) |
|---|---|---|---|
| a+ b+ c+ | a− b− c− | a+ | 25 b+ |
| a+ | 3 c+ |
Is the b or c gene closer to a? Explain your reasoning.
Question 24
24.For the H1N1 influenza virus shown at the bottom of Figure 7.29, viruses from which organism contributed the most RNA to the virus?