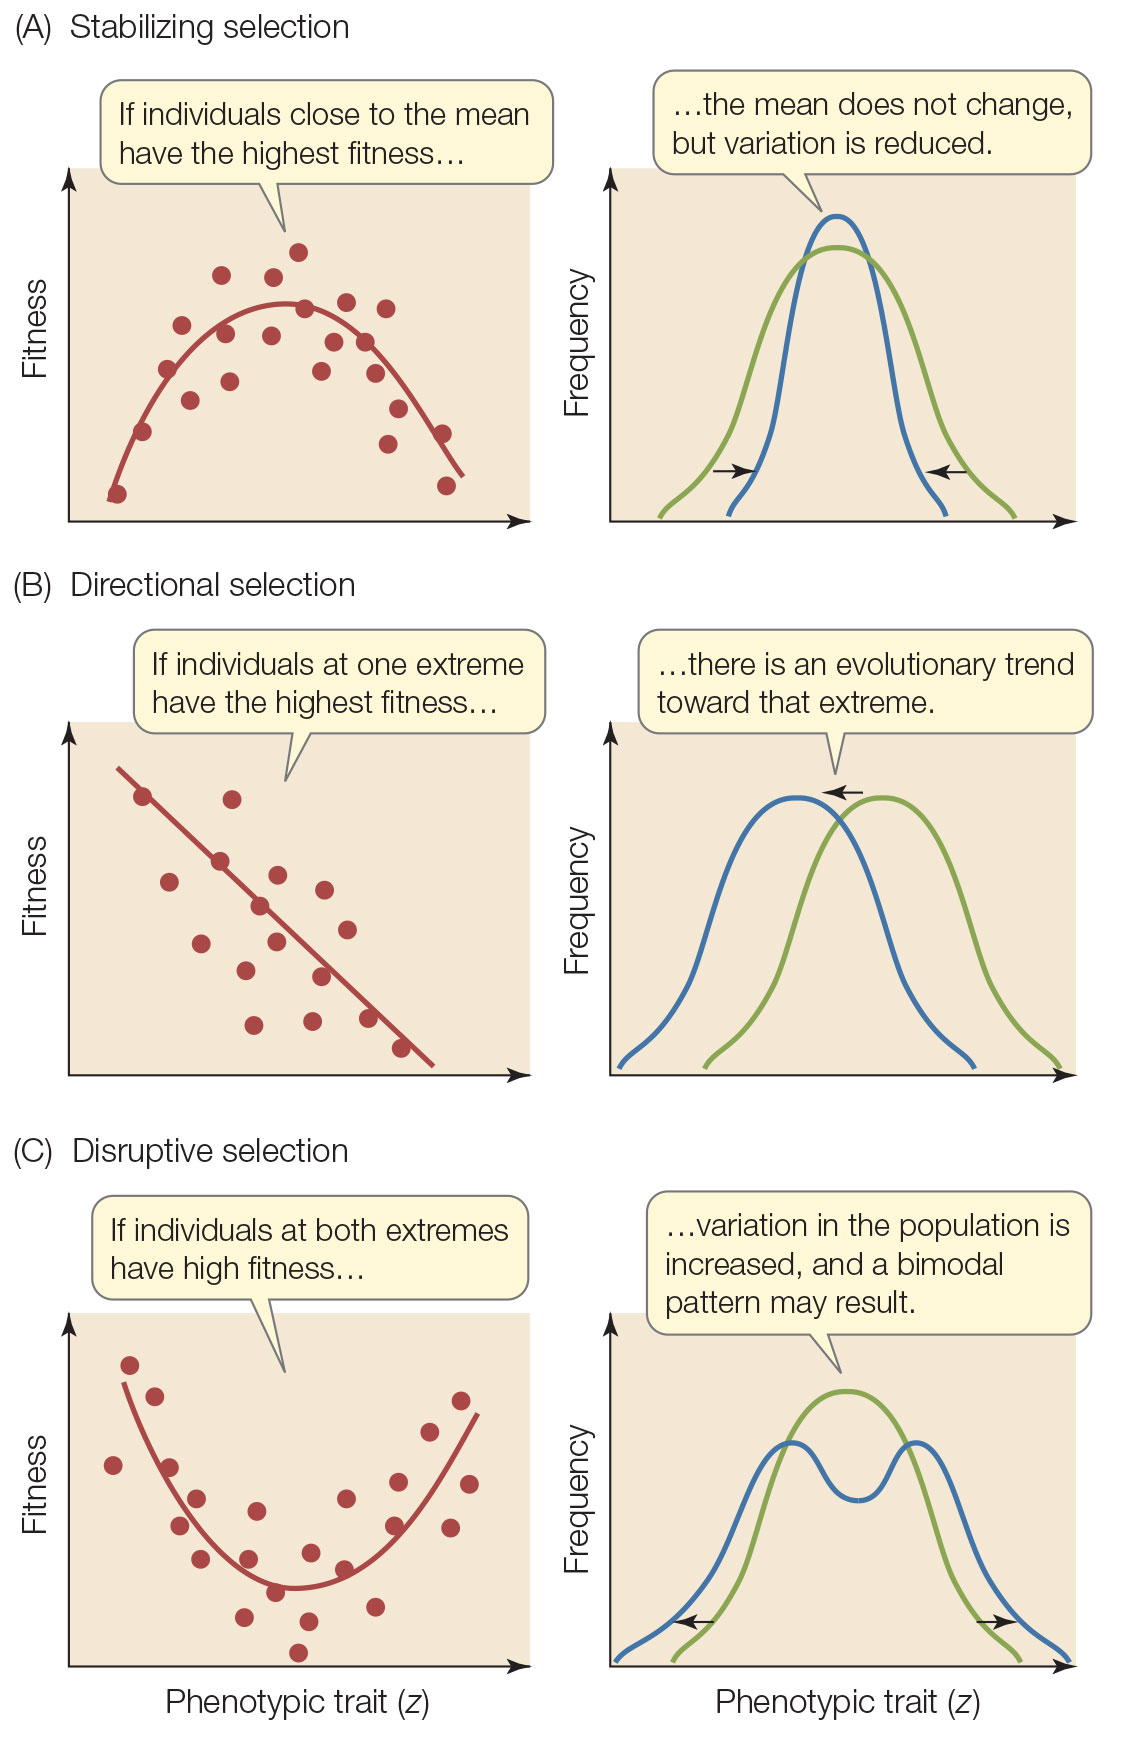
Figure 15.13: Natural Selection Can Operate in Several Ways The graphs in the left-hand column show the fitness of individuals with different phenotypes of the same trait. The graphs on the right show the distribution of the phenotypes in the population before (green) and after (blue) the influence of selection.