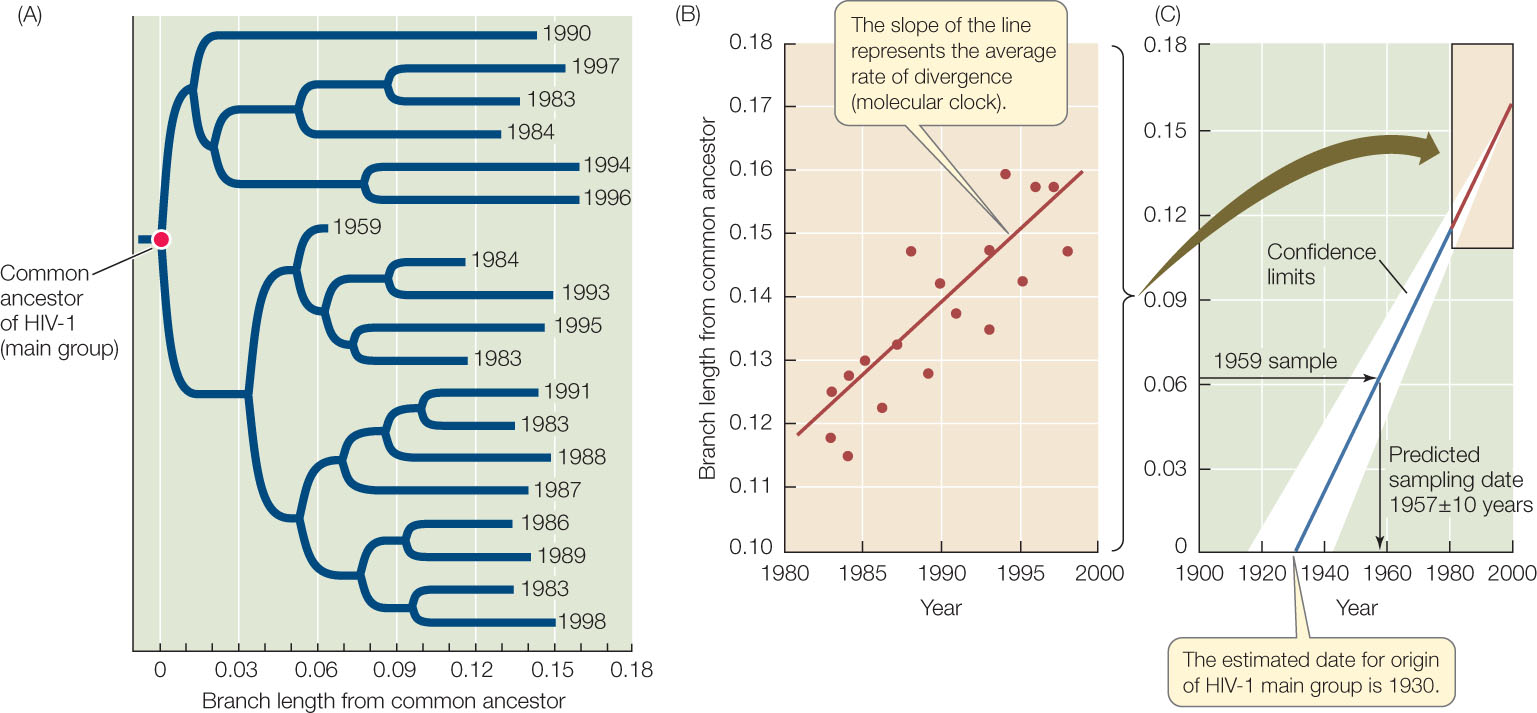
Figure 16.11: Dating the Origin of HIV-1 in Human Populations (A) A phylogenetic analysis of the main group of HIV-1 viruses. The dates indicate the years in which samples were taken. (For clarity, only a small fraction of the samples that were examined in the original study are shown.) (B) A plot of year of isolation versus genetic divergence from the common ancestor provides an average rate of divergence, or a molecular clock. (C) The molecular clock is used to date a sample taken in 1959 (as a test of the clock) and the unknown date of origin of the HIV-1 main group (about 1930). Branch length from a common ancestor represents the average number of substitutions per nucleotide.