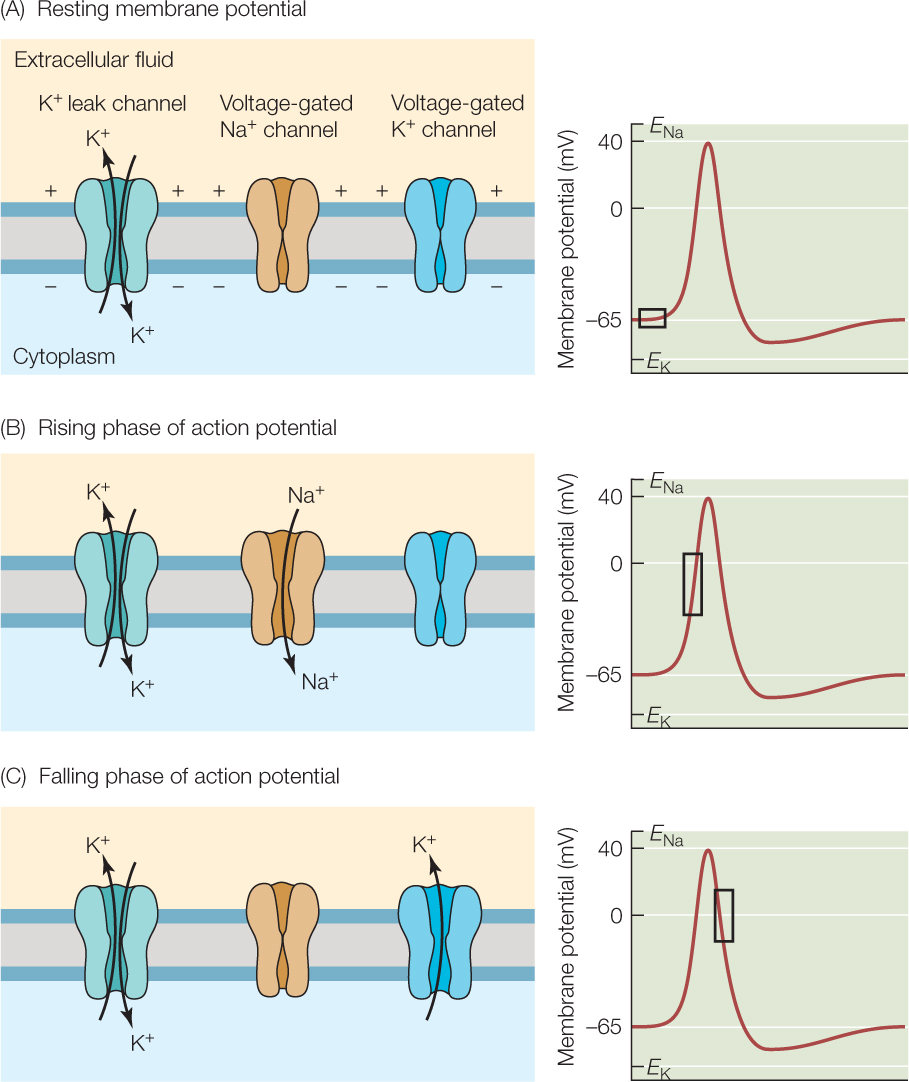
Figure 34.7: Production of an Action Potential The diagrams to the left show changes in voltage-gated Na+ and K+ channels, and those on the right show changes in membrane potential during (A) rest, (B) the rising phase of an action potential, and (C) the falling phase. The black rectangles on the membrane potential curves indicate the part of the curve during which the events diagrammed at left occur. The closing of the Na+ channels in (C) is of a specialized type (called inactivation) that cannot be reversed (i.e., the channels cannot reopen) for a brief period. K+ leak channels are always open.