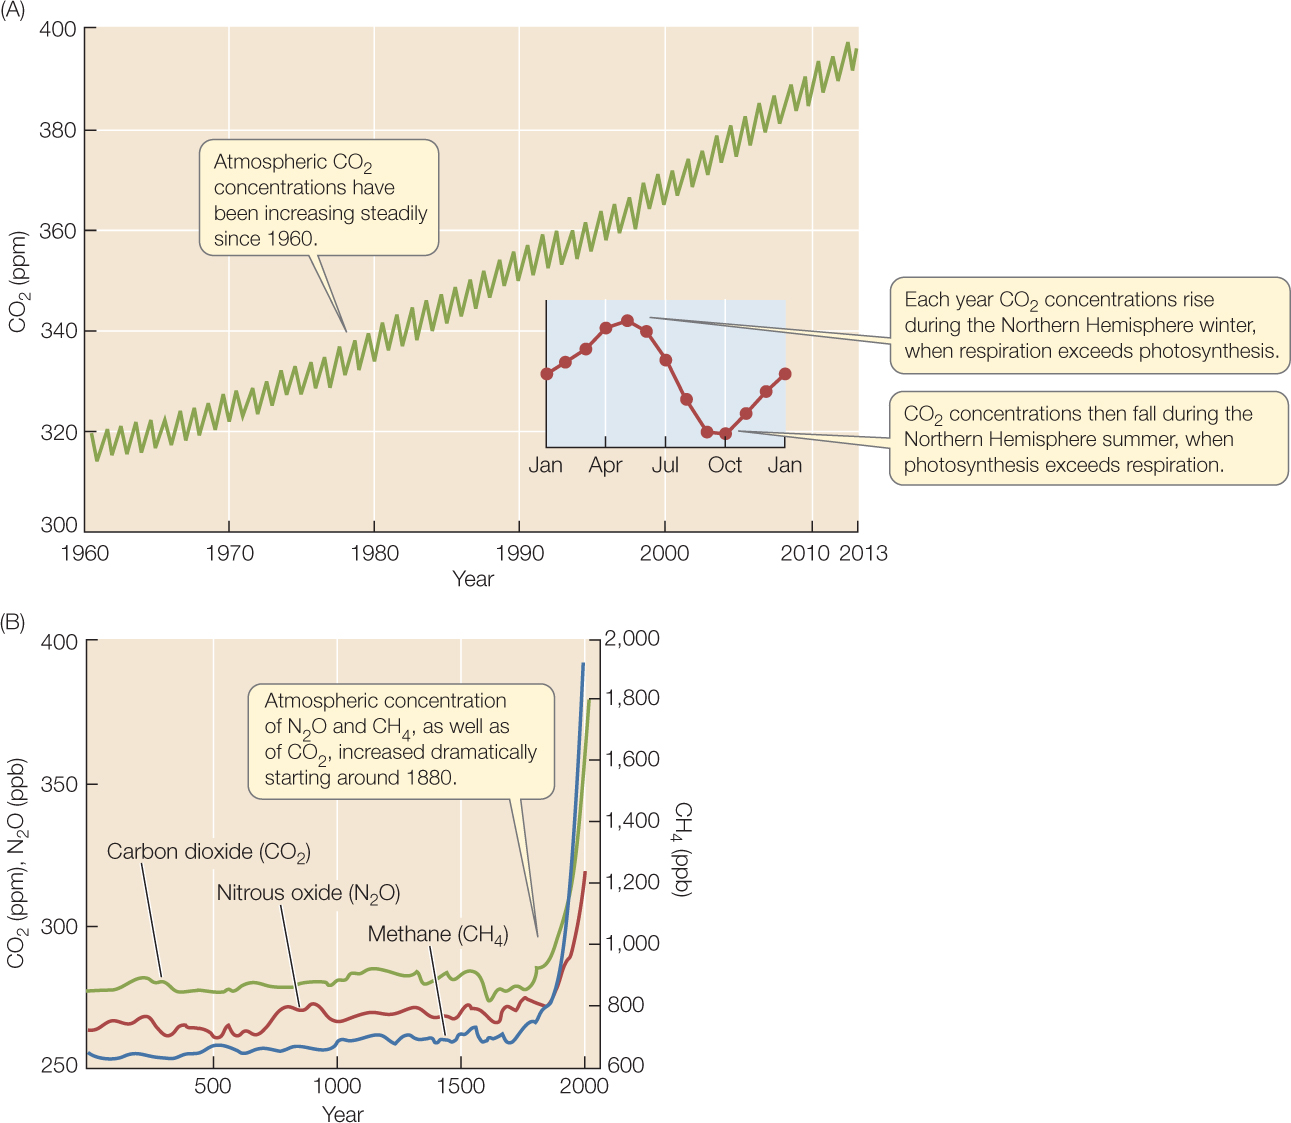
Figure 45.12: Atmospheric Greenhouse Gas Concentrations Are Increasing (A) The Keeling curve shows measurements of atmospheric CO2 concentrations atop Mauna Loa, Hawaii, expressed as parts per million (ppm) by volume of dry air. (B) Measurements of air trapped in glacial ice have allowed researchers to extend our record of greenhouse gas concentrations back 2,000 years. Concentrations are expressed as parts per million (ppm) for CO2 and parts per billion (ppb) for nitrous oxide (N2O) and methane (CH4).