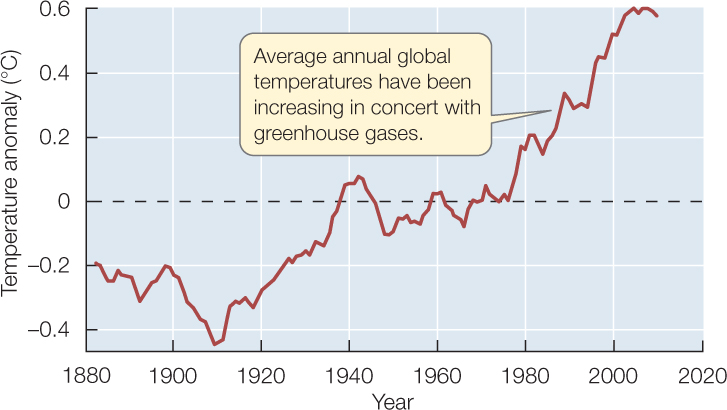
Figure 45.13:
Average Annual Global Temperatures Are Increasing
The curve shows the deviation from the average global temperature for the period 1951–1980 (indicated by 0).