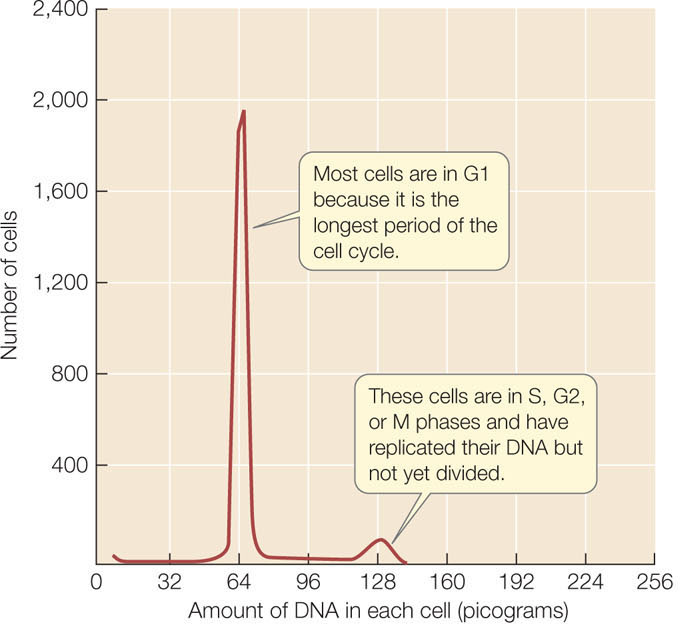
Figure 9.1:
DNA in the Cell Cycle
When dividing cells are stained and analyzed by flow cytometry, there are two populations in terms of DNA content, seen as two peaks in the above graph.