2.1 PRACTICE EXERCISES
Organizing Data
Question 2.1
Researchers collected the following data during individual investigations. Identify which class of variables exists in each data set.
A survey was performed on the reproductive success of a local bird population. Researchers counted the number of eggs in individual bird nests in hopes of determining the most frequent clutch size: {3, 4, 5, 6, 4, 5, 6, 7, 3, 8, 9, 5, 6, 7}
A recent survey, for the purpose of determining the relative cigarette consumption of males aged 35–40, revealed the following data: {15 non-smokers, 23 light smokers, 5 heavy smokers}
Researchers trying to determine the genetic cause of a trait tested 23 individuals and discovered a single nucleotide polymorphism at a specific locus. The following is the data for a single nucleotide polymorphism (SNP) at a specific locus for each individual in the study: {A, T, G, G, T, A, C, G, T, A, C, C, G, T, G, C, A, T, A, T, C, C, G}
Students studying the effect of trichome density on herbivory calculated the following: trichome density (number of trichomes/0.25cm2): {135.0, 166.3, 173.4, 175.0, 191.1, 192.4, 192.5, 199.9, 206.8, 212.2}
Question 2.2
Using each of the individual data sets from Question 1:
Construct a data table for each data set (a-d).
Based on each data table, create an appropriately labeled graph for each of the four data sets. Justify the selection of the type of graph for each data set.
Question 2.3
The table below shows the weight and length measurements from a sample (n = 30) of the freshwater fish Abramis brama collected from Lake Laengelmavesi. Answer (a–c) using the data in the table.
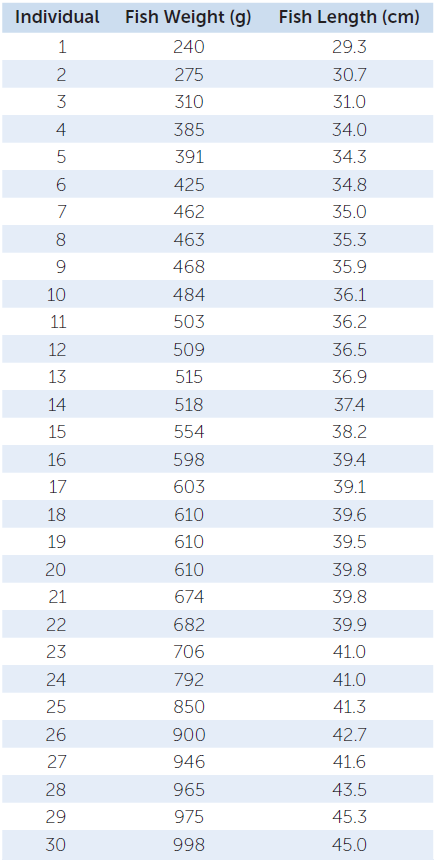
Describe a strategy you could use to combine the weight data to graphically visualize the data more clearly. Identify the most appropriate type of graph for the weight data only.
Describe a strategy you could use to combine the length data to graphically visualize the data more clearly. Identify the most appropriate type of graph for the length data only.
Identify the most appropriate type of graph to show how the weight of the fish affects the length of the fish. Describe a graphing strategy you could use to support the impact of weight of fish on the length of fish.
Question 2.4
There are many different types of graphs. For the data below, identify the appropriate type of graph to best represent the following data sets with no further data manipulation. You may choose from: bar chart, pie chart, histogram, box-and-whisker, and scatter plot. Each data set may be represented by more than one of the types of graph.
Various fish species caught on a fishing trip to a freshwater lake: 35 northern pike, 46 perch, 24 bass, 17 walleye, 49 blue gills
The percentage of geckos as pets in the United States during 2014: 45% crested, 25% leopard, 30% electric blue
Patient samples (n = 100) collected by a researcher of both weight and height to support the claim that weight increases proportionally with height
In a sample of Drosophila melanogaster, the following observed phenotypic proportions in a population: brown eyed: 0.2, red eyed: 0.7, white eyed: 0.1
The number of trichomes on a soybean plant based on the age of the plant counted by a researcher
In a particular forest ecosystem observed by a researcher: 26 robins, 37 blue jays, 29 cardinals, and 51 pigeons in an environment
Of 15 wolves (Canis lupus) in Yellow Stone National Park researched by a student, the minimum weight was 24 kg, the median weight was 56 kg, the maximum weight was 75 kg, the first quartile was 39 kg, and the third quartile was 66 kg
The relative frequency of different types of prey in the diet of Thamnophis sirtalis: 0.26 rodents, 0.15 insects, 0.10 lizards, 0.24 amphibians, 0.25 minnows
Summarizing Data
Question 2.5
Practice working with the mean.
When considering a set of data, describe what additional information calculating the mean provides.
A researcher wanted to investigate the effect of availability of prey on the length of a particular species of snake found in a northern Michigan forest. Calculate the mean length (cm) of the following sample of snakes: 24 cm, 43 cm, 43 cm, 48 cm, 56 cm, 61 cm, 63 cm, 259 cm
Look closely at the data in part (b). Predict whether the mean length of this sample of snakes is an accurate representation of the mean length of the snakes in the underlying population. Justify your claim.
Predict the effect on the mean length if researchers observed one thousand additional snakes. Describe how the increased sample size affects the accurate representation of the underlying population.
Describe two factors that may cause the mean to be less representative of a particular data set.
Question 2.6
Practice working with the median.
Ten student lab groups investigating transformation efficiency of a specific species of bacteria using a novel technique reported their transformation efficiency in numbers of colonies transformed per microgram of DNA. Each of the lab groups obtained identical data: 1, 2, 3, 3, 3, 4, 5, 9, 10, 10. Calculate the mean and median of the reported transformation efficiencies. Describe the value that is provided by each of the calculations to the teacher as the teacher considers this new technique.
When considering a set of data, explain how knowledge of the median better describes the data.
Calculate the median of the snake lengths in Question 5b.
Predict whether an extreme data point more likely distorts the sample mean or the median. Justify your answer.
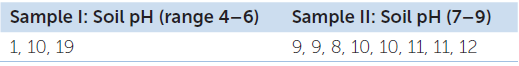
A researcher is investigating the effect of the pH of soil on the height of oak trees in a deciduous forest in southern Illinois. He obtains data for two samples of five-year-old oak trees grown in different soils, shown below. Calculate the mean and median for each sample. Based on only the mean and median for each sample, justify the researcher’s claim that the pH of the soil has no impact on the height of a plant.
954
Question 2.7
Practice working with the mode.
Describe the purpose of calculating the mode of a sample.
Calculate the mode of the snake lengths in Question 5b.
The mode is less frequently calculated and used to describe biological data. Using the data above, justify the claim that knowledge of the mode is not as useful for describing this particular biological data set as is the knowledge of the mean and median.
In describing a biological data set, identify the type of variable(s) knowledge of the mode would be most useful.
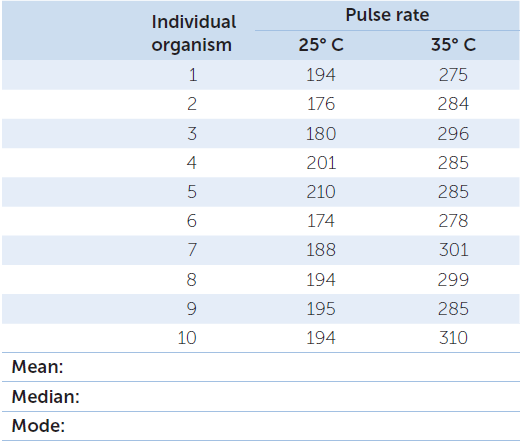
A researcher was investigating the effect of temperature on the pulse rate of Daphnia nivalis, an endangered species of invertebrate endemic to Australia. The data is shown below. Calculate the mean, median, and mode for the sample of Daphnia at each temperature. Evaluate the value of mode, median, and mean for this data.
Question 2.8
Practice working with the range.
Explain the usefulness of calculating the range for a particular set of data.
Calculate the range of the snake lengths in Question 5b.
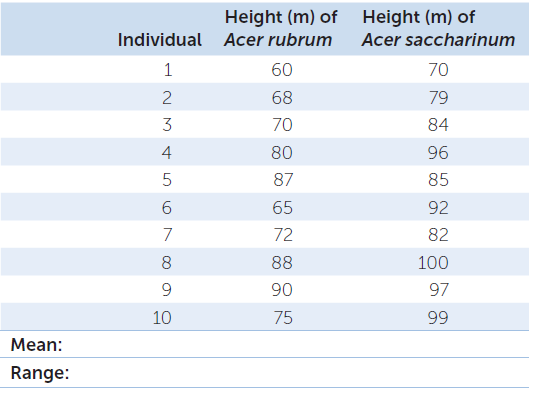
A researcher collected height measurements, shown below, for ten mature red maple trees (Acer rubrum) in a section of a deciduous forest in Maine. Another researcher collected height measurements for ten mature silver maple trees (Acer saccharinum) in the same forest. Calculate the mean and range for each set and describe the data.
Question 2.9
Practice working with the standard deviation.
Explain the usefulness of calculating the standard deviation of a sample.
Given the scenario and data in Question 6e, if a student made the choice to present the data with a bar graph comparing the means, explain how this might lead to incorrect inferences about the data. Calculate the standard deviation for both samples.
Again using the scenario and data in Question 6e, describe the usefulness of including the standard deviation with the mean when comparing the two data sets.
One standard deviation on either side of the mean in a population represented by a normal curve is approximately 33%. In a sample of 100 females in the United States, identify the percentage of females who would fall within the range of 155–175 cm height range if the mean height of adult females is 165 cm. Predict the percentage of females within the sample who would fall within the 145-185 cm height range.
Question 2.10
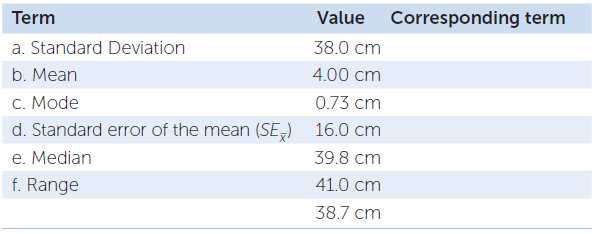
Using the data in Question 3 showing length measurements from a sample of Abramis brama from Lake Laengelmavesi, connect the following terms with the appropriate calculated value regarding fish length.
Question 2.11
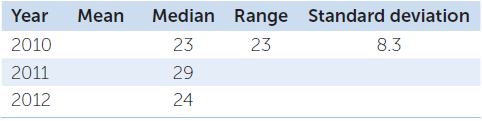
Currently, the Asian carp (Ctenopharyngodon idella) is an invasive species to the Great Lakes region of the United States. Concerned for the well-being of the aquatic ecosystem, the fisherman set out to eradicate the Asian carp from the Great Lakes. They recorded catch sizes for seven independent outings over a three-year period. Their data is recorded below in an incomplete table:
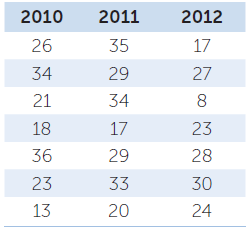
Construct a data table that better describes the events (catch size/years/species caught) over the three-year period.
For each year, calculate the mean, range, and standard deviation.
955
Identify the summer that had the largest range and standard deviation in catch size. Describe what information the mean, median, range, and standard deviation provides to the researcher.
Create a bar chart for each summer’s mean. Include ± 1 standard deviation on the graph.
Inferential Statistics
Question 2.12
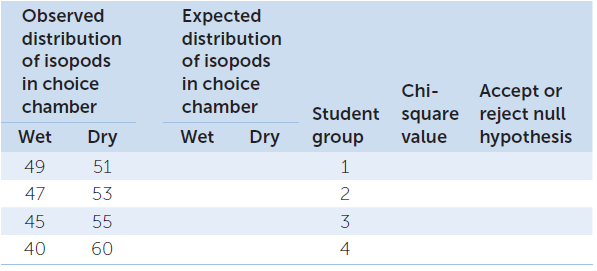
Isopods are a type of terrestrial crustacean that exchange gases with their environment by the use of gills. In an investigation into isopod behavior, a choice chamber is used to test whether the distribution of isopods in the fly chamber is affected by moisture. The student places 100 isopods in the middle of the choice chamber. A piece of wet cotton is placed at one end of the chamber and a piece of dry cotton is placed at the other end. The student hypothesized that isopods need humid conditions to breathe with gills, and therefore there will be a larger number of isopods on the side with the wet cotton after 30 minutes.
Specify the null hypothesis (H0) for this investigation. Describe how the null hypothesis varies from the hypothesis (HA) the student stated.
After observing and recording the movements of the isopods after 30 minutes, the student obtains the following data. The student also obtains the data from three other lab groups, all of whom had stated the same initial hypothesis. Perform a chi-square test on the data for each of the student groups. Enter the values from your calculations in the table below. Based on each group’s individual results, predict whether each group accepted or rejected their null hypotheses based on one degree of freedom and p = 0.05.
Question 2.13
Using the data and the data table you constructed for Question 11, for the following questions:
Calculate the standard deviation and the standard error of the mean for each year.
Based on the equations for standard deviation and standard error of the mean, identify at least one difference between the standard deviation and the standard error as it relates to the mean.
Create an appropriately labeled graph to illustrate the sample means of the three years of catch data to approximately 66% confidence (sample mean ± 1
 ).
).Now, modify the error bars to illustrate the sample means of the three years of catch data to within approximately 95% confidence (sample mean ± 2
).Construct a null hypothesis (H0) and an alternate hypothesis (HA) to describe the relationship of mean number of fish caught per summer.
Based on the data, predict whether the researcher accepted or rejected the null hypothesis.
Describe the appearance of the standard errors of the mean error bars that would result in the researcher rejecting the null hypothesis.
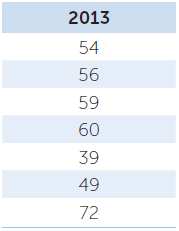
The fishermen continued to catch Asian carp in 2013. The following is the data from 2013. Add this data to the chart you constructed for Question 11b.
A student hypothesized that the 2013 mean fish catch was “no different than any other fishing trips.” Based upon the means and the standard errors of the mean (± 2
) predict whether the student’s null hypothesis will be accepted or rejected. Justify your claim.
Question 2.14
Using the flow chart in Figure B13, for (a–c) below, identify which type of statistical test could be performed to generate statistical inferences around the data.
A researcher is investigating if the body weights of female lizards during pregnancy affect clutch size.
A researcher is investigating if variation in human eye color is related to variation in body height.
A researcher is investigating if the mean plant height of oak trees is similar between neighboring forests in northern Ohio.