Concept 41.1: Ecological Systems Vary over Space and Time
During the Age of Exploration of the eighteenth and nineteenth centuries, the prospect of visiting unknown lands filled with unfamiliar plants and animals lured many European scientists—including Charles Darwin—to travel the world. They described and took careful measurements of a tremendous variety of environments and organisms on their journeys, thus initiating the study of two new topics: physical geography, the spatial distributions of Earth’s climates and surface features; and biogeography, the spatial distributions of species. It soon became apparent that the distributions of species and environments are linked.
Organisms and their environments are ecological systems
The link between physical geography and biogeography is not surprising, because all organisms, humans included, are surrounded by and interact with an external environment that is made up of nonliving (abiotic) and living (biotic) components. These components—one or more organisms and the environment with which they exchange energy and materials—make up an ecological system.
The term “ecological” derives from ecology, a word that the German biologist Ernst Haeckel constructed in 1866 from the Greek roots oikos, “household,” and logia, “study of.” Haeckel meant this word to describe “the entire science of the relations of the organism to its external environment.” Ecological knowledge is very old, for even the earliest humans understood a great deal about the plants and animals they depended on for food, the animals that competed with them for food, and the organisms and physical circumstances that presented natural hazards. Indeed, the earliest available religious texts and scholarly writings are full of ecological topics. By coining a formal term, however, Haeckel not only helped establish the study of “all those complicated interrelations described by Darwin as the conditions of the struggle for existence” as a formal science, but also underscored ecology’s relevance to Darwin’s theory of evolution by natural selection.
Ecological systems can be small or large
A system is defined by the interacting parts it contains. But scientists have a great deal of freedom to choose which set of interacting parts to study. In the case of ecological systems, we can draw a boundary around any part of the biological hierarchy from the individual organism on up (see Figure 1.5). Each successive level of this ecological hierarchy brings in new interacting parts at progressively larger scales of space and time.
At the smallest scale is the fundamental ecological unit: the individual organism and its immediate environment. Individuals remove materials and energy from the environment, convert those materials and energy into forms that can be used by other organisms, and by their presence and activities, modify the environment. In aggregate, these individual-level exchanges determine the nature and magnitude of interactions at higher levels of the hierarchy.
The individual organism is part of a population: a group of individuals of the same species that live, interact, and reproduce in a particular geographic area. The assemblage of interacting populations of different species within a particular geographic area forms a biological community. As we expand the geographic area included within the boundary of our ecological system, we include multiple communities in landscapes until, at the largest scale, we include all the organisms of Earth and the environments they occupy—the entire biosphere. Ecologists tend to replace the term “ecological system” with ecosystem when they are explicitly including the abiotic components of the environment, and in particular when they are considering communities and their environmental context.
Large ecological systems tend to be more complex than small ones, not only because they contain more interacting parts, but also because those parts interact over a greater span of space and time. The components of the biosphere, for example, are linked not only by the rapid and localized exchanges between individual organisms and their surroundings, but also by slower and more extensive migrations of organisms, great cycles of air and water movement, and even the much slower geological churning of Earth’s crust.
Even when very small, however, ecological systems can be complex. Consider an ecosystem within each of us—the human intestine. It is one of the most densely populated ecosystems on Earth, hosting hundreds of species of bacteria, archaea, and yeasts, and on the order of 1012 individual microbes per gram of fecal material. The microbial cells in our bodies vastly outnumber our own trillion or so human cells, and their combined metabolism rivals that of an organ such as the human liver.
It’s no surprise that microbes thrive in the mammalian gut. Mammals regulate the gut’s physical environment within narrow limits of temperature and chemistry, and they supply it with a steady stream of ingested nutrients. Gut microbes metabolize food materials, including some that the host cannot digest, and excrete waste products that provide nutrition to the host or to other members of the microbial community. Microbial species interact with one another and with host cells by forming layers (biofilms) that coat the gut lining.
As with any system, these interactions determine the properties of the whole and its components: they affect host nutrition and immune function as well as the makeup of the microbial community itself. In fact, a number of human diseases—including infection by pathogenic gut microbes, irritable bowel syndrome, obesity, and wasting diseases such as kwashiorkor—have been linked to disruption of the gut’s microbial community.
LINK
Human health is linked to the health of our microbial communities. Review the description of the communities of microbes that live on and in our bodies in Concept 19.3
847
Ecological systems vary, but in ways that can be understood with scientific methods
The biotic and abiotic components of ecosystems are distributed unevenly in space, as European scientists discovered during the Age of Exploration. Individual ecosystems also change over time, as cattle ranchers in the Borderlands discovered to their dismay. Such variations may be bewildering at first, but further study often reveals repeated patterns that provide clues to their causes.
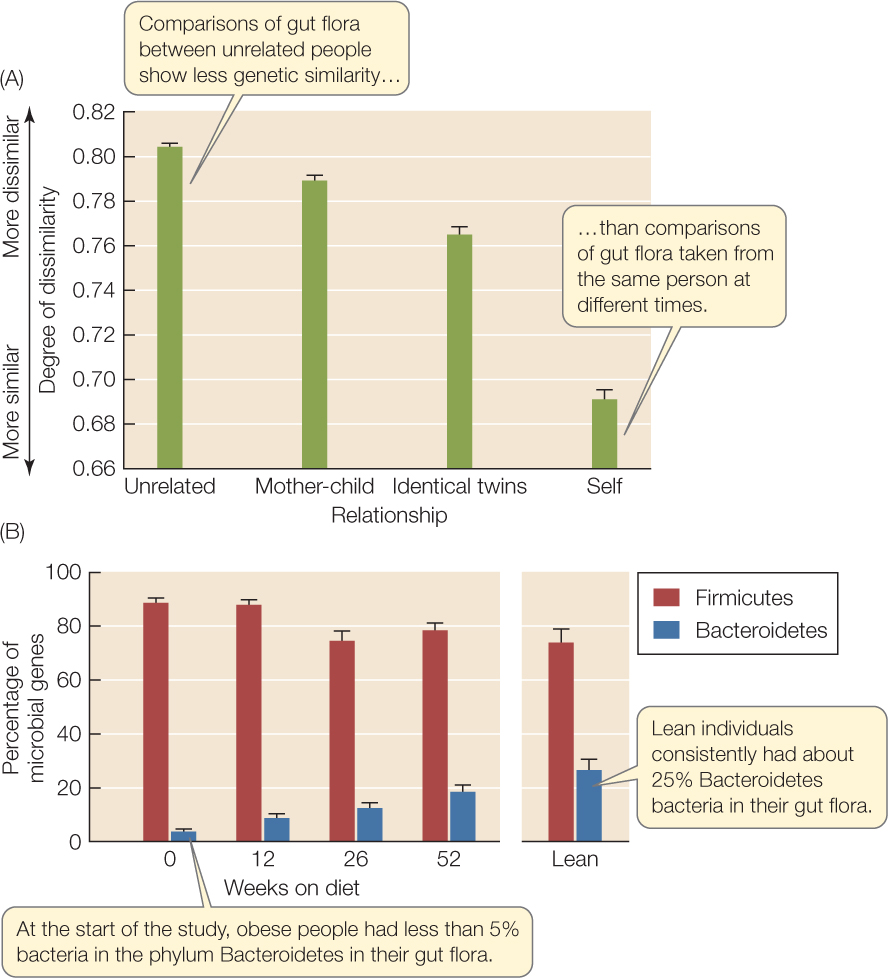
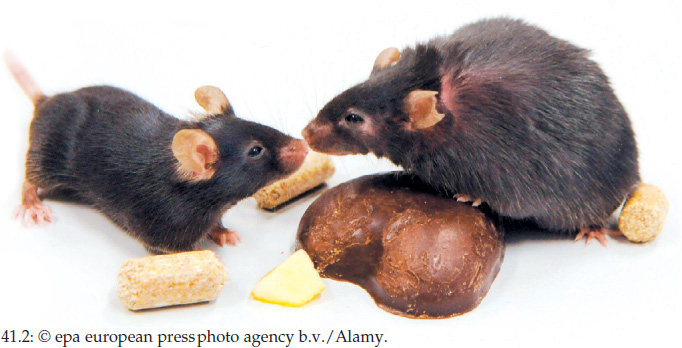
The ecosystem of the human gut illustrates this spatial and temporal variation, and scientists are using natural history observations, experiments, and modeling to understand it. With modern molecular methods (see Figure 12.6), we can now characterize the phylogenetic and functional properties of entire gut microbial communities, which is impossible with traditional culture techniques because many gut microbes won’t grow outside the gut. The first surveys revealed bewildering variation: each person, it turns out, has a unique gut community. More recent work, however, has demonstrated that there is some order to this variation. The gut communities of genetic relatives, for instance, are more similar than are those of unrelated people (FIGURE 41.1A), suggesting that a host’s genotype favors some microbes over others. In addition, the gut communities of obese and lean people differ in their ratios of two bacterial phyla. When obese people lose weight on experimental calorie-restricted diets, the ratios of these two bacterial phyla become more like those of lean people (FIGURE 41.1B), suggesting that diet also affects the gut community. The relationship between gut community and obesity appears to be a two-way street, because systems models of nutrient processing by different microbial groups indicate that obesity might be related to how much energy the community can extract from food. This conclusion is supported by transplant experiments done with mice, whose gut ecology is similar to ours (FIGURE 41.2). Exciting results such as these open the door to new therapies that use ecological principles to restore human health by manipulating our “ecosystem within.”
CHECKpoint CONCEPT 41.1
- What two components make up the external environment of organisms?
- Explain why ecological systems at large scales tend to be more complex than smaller-scale systems.
- Humans often experience digestive problems after taking a course of antibiotics to treat a bacterial infection. Why might this be so?
Variation over space and time can be seen in ecosystems at all scales, from the human gut to the entire biosphere. We will now turn to some of the physical factors that underlie this heterogeneity at the biosphere scale: Earth’s climates and topography.
Investigation
HYPOTHESIS
The gut microbial community of obese mice contributes to their obesity.
METHOD
- Rear +/+ mice to adulthood in a germ-free environment so that their guts contain no microbes.
- Select 9 mice at random to have their guts inoculated with fecal material obtained from obese ob/ob donors, and select 10 mice at random to be inoculated with material from lean +/+ donors.
- Verify that the recipient mice have developed microbial communities similar to those of the donors.
- Feed both groups of recipient mice on mouse chow containing 3.7 kcal/g. Measure the food intake of the mice over the next 2 weeks.
- Use a noninvasive body-scanning method to measure changes in the body fat content of the two groups of recipient mice over the same 2-week period.
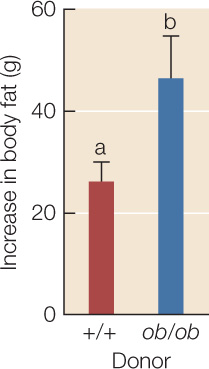
RESULTS
Both groups of recipients gained body fat during the 2 weeks, but those inoculated with gut material from an ob/ob donor gained more body fat than mice that received +/+ gut material, even though they ate the same amount of food. Error bars indicate 1 standard error from the mean; bars with different letters are statistically different from one another.
CONCLUSION
The Firmicutes-dominated gut community of obese mice contributes to their obesity.
ANALYZE THE DATA
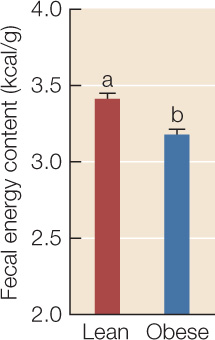
Bacteria in the phylum Firmicutes are particularly adept at breaking indigestible dietary polysaccharides into monosaccharides and fatty acids that mammals can absorb. The researchers therefore hypothesized that the reason a Firmicutes-dominated gut community contributes to obesity is that it is more efficient at extracting energy from food. To evaluate this hypothesis, the researchers collected all feces produced in 24 hours by 13 ob/ob mice and 9 +/+ or ob/+ littermates, then burned them in a closed chamber and used the temperature change to measure the energy content of each gram of feces. Error bars indicate 1 standard error from the mean; bars with different letters are statistically different from one another.
- Do these results support the hypothesis that the gut communities of obese mice are more efficient at harvesting energy from ingested food? Explain.
- Does it matter to your conclusion that ob/ob mice typically eat more chow than +/+ or ob/+ mice?
- Assume that mice store all the excess energy they obtain in the form of body fat, and that mouse fat contains 9.3 kcal/g. If the ob/ob recipient mice added 0.44 g more body fat than the +/+ recipients in 24 hours, how much more energy did they obtain from their food in this time period?
- If both groups of recipients consumed 55 g of chow, what percentage of the energy consumed in chow does this extra energy gain represent? (Hint: Recall that the energy content of chow is 3.7 kcal/g.)
Go to LaunchPad for discussion and relevant links for all INVESTIGATION figures.
aP. J. Turnbaugh et al. 2006. Nature 444: 1027–1031.
848
849