DIETARY GUIDELINES FOR AMERICANS
Sometimes, the best option isn’t immediately obvious, so government agencies issue guidelines that make it easier to identify what’s most nutritious. Those guidelines change with the times—during widespread economic crisis and food rationing, the focus was on adequate nutrient intake. But, today, cheap calories are more abundant than ever, so the current guidelines focus on how to get the nutrients we need to lead a healthy lifestyle and reduce the risk of chronic disease.
30
DIETARY GUIDELINES FOR AMERICANS (DGAs) national health guidelines that provide information and advice, based on scientific evidence, on how to choose a healthy eating plan
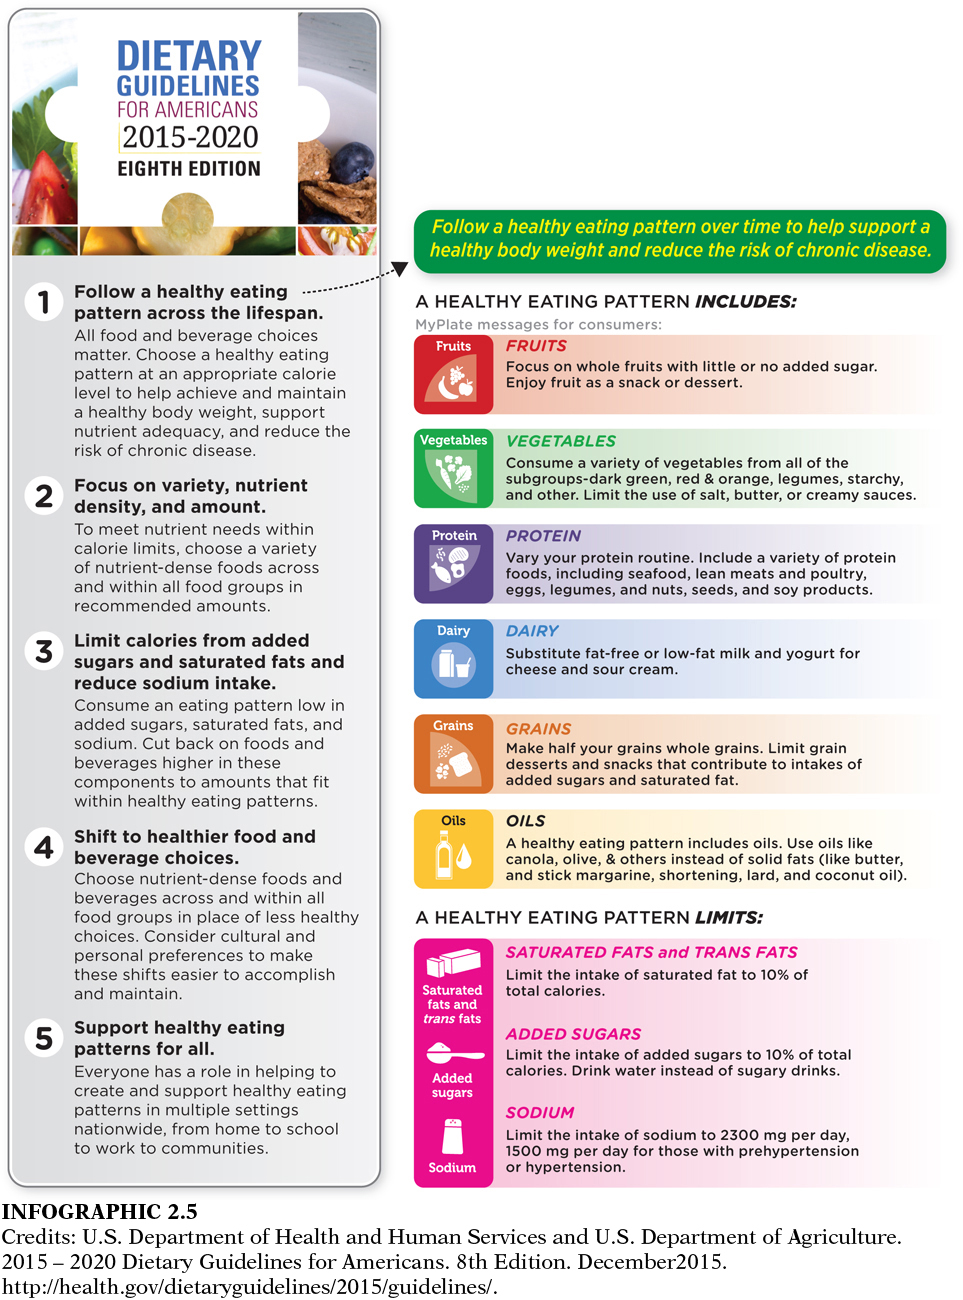
To help people make nutritious choices, experts created tools such as the Dietary Guidelines for Americans (DGAs), which provide essential advice for how to eat healthfully and reduce the risk of chronic diseases. Since their creation in 1980, the DGAs have been updated every five years by the United States Department of Agriculture (USDA) and the Department of Health and Human Services (HHS), according to the newest science-based information about nutrition and health, and they provide the core of federal food and nutrition education programs. (INFOGRAPHIC 2.5)
31
Question 2.5
 Give an example of a specific grain product that will often contain a significant amount of saturated fat.
Grain-based desserts and dairy desserts carry high amounts of solid fats and added sugars.
MyPLATE visual presentation of foods from five food groups “on a dinner plate” to represent the ideal balance that will provide a spectrum of nutrients
The 2015 Dietary Guidelines for Americans (DGAs) focus on healthy eating patterns—the combinations of all the foods and drinks that we consume over time, and not on specifi c foods or nutrients. Three healthy eating patterns are provided as examples, U.S.-style, Mediterraneanstyle, and Vegetarian, which can be adapted to meet personal preferences. It is emphasized that all foods consumed as part of a healthy eating pattern fi t together like the pieces of a puzzle to meet our nutrient needs without exceeding limits for sodium, saturated fat, added sugars, and total calories. All the pieces of this food puzzle are necessary to promote good health and prevent disease.
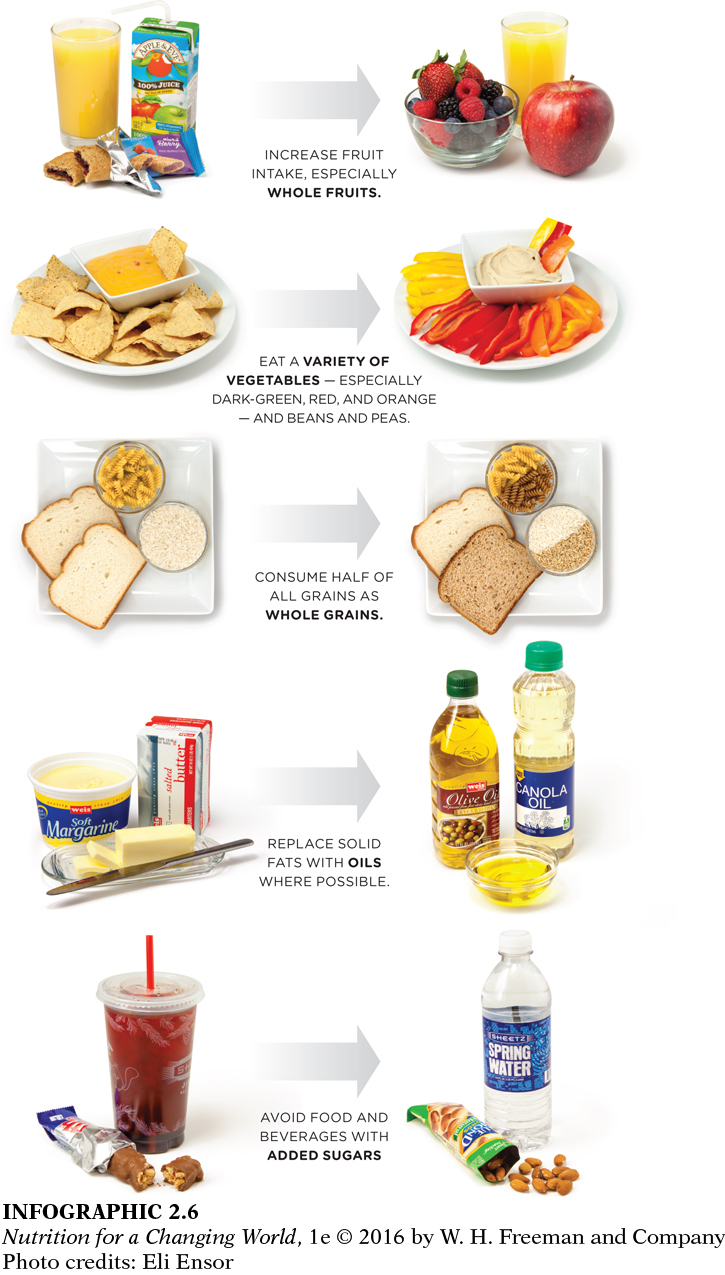
The current Dietary Guidelines also focus on improving the diet of Americans by encouraging small shifts in eating habits to align our diet with these healthy eating patterns. Emphasis is placed on the need to substitute nutrient-dense foods and beverages for less healthy choices (those that are high in saturated fat, added sugars and/or sodium, and calories). (INFOGRAPHIC 2.6) Specifically, the DGAs recommend that Americans consume a variety of fruits, vegetables, and protein foods (including fi sh, poultry, legumes, nuts, and lean meats). They also recommend that we replace refi ned grains with whole grains, and solid fats with oils; and limit the consumption of saturated fat (to 10% of total calories) and sodium. The limit for sodium is set at 2,300 milligrams per day for adults and children 14 years and older because excess sodium intake can increase the risk of high blood pressure (hypertension) and heart disease. For adults with prehypertension or hypertension it is recommended that they further reduce sodium intake to 1,500 mg per day to allow for greater reductions in blood pressure. For the fi rst time, the 2015 DGAs also specifi cally recommend that added sugars be limited to 10% of total calories. Because added sugars contribute calories to the diet but no essential nutrients, their consumption above recommended levels can make it diffi cult to meet nutrient requirements without consuming excess calories. Lastly, because the environments we live, learn, and work in dramatically infl uence our behaviors, the Dietary Guidelines remind us that everyone has a role in supporting individuals as they shift their food and activity choices to improve their health.
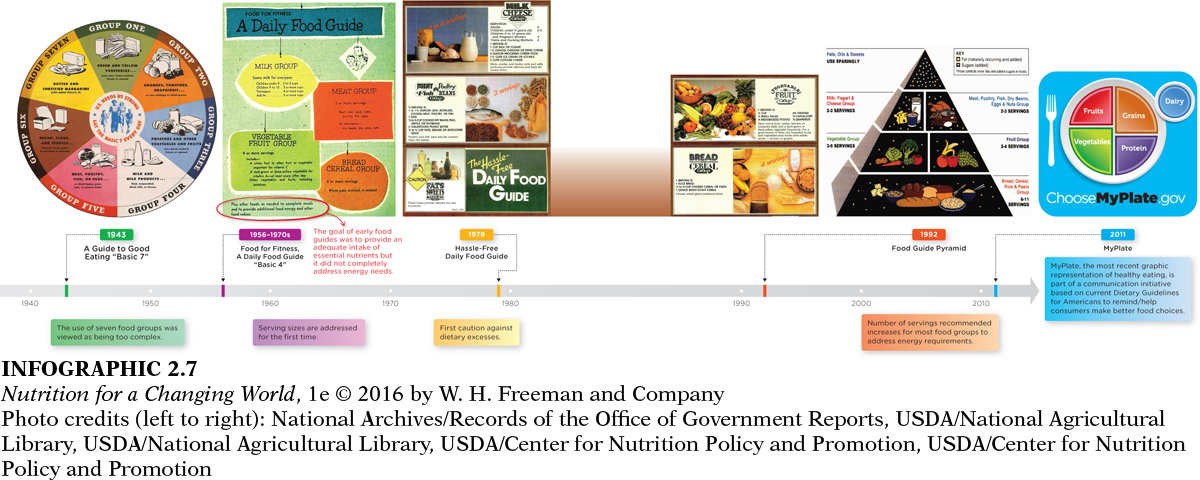
To put all of this food advice into action, the USDA, the agency that regulates farming and food production, updates tools to make it easier for people to consolidate dietary advice when choosing meals. During the 1940s, for instance, the government promoted the Basic 7, in which people were encouraged to eat something from each of seven categories of foods (meat, milk, green/yellow vegetables, etc.). This system was designed to provide a foundation to help Americans meet nutrient needs when food was scarce. The Basic 7 eventually became the Basic 4 in the 1960s and 1970s, which painted a simpler picture of a nutritious diet but lacked specific guidance about fats, sugar, and calories. In the 1990s, a new Food Pyramid ranked the five food groups by how much of each to consume per day. The iconic pyramid illustrated graphically the key concepts of variety, moderation, and proportion. After 20 years of promoting variations on the Food Pyramid, in 2011 the USDA released MyPlate—a new tool to help consumers make better food choices. (INFOGRAPHIC 2.7)
32
Question 2.6
What are the food groups currently represented in the MyPlate graphic and in what proportion are they shown?
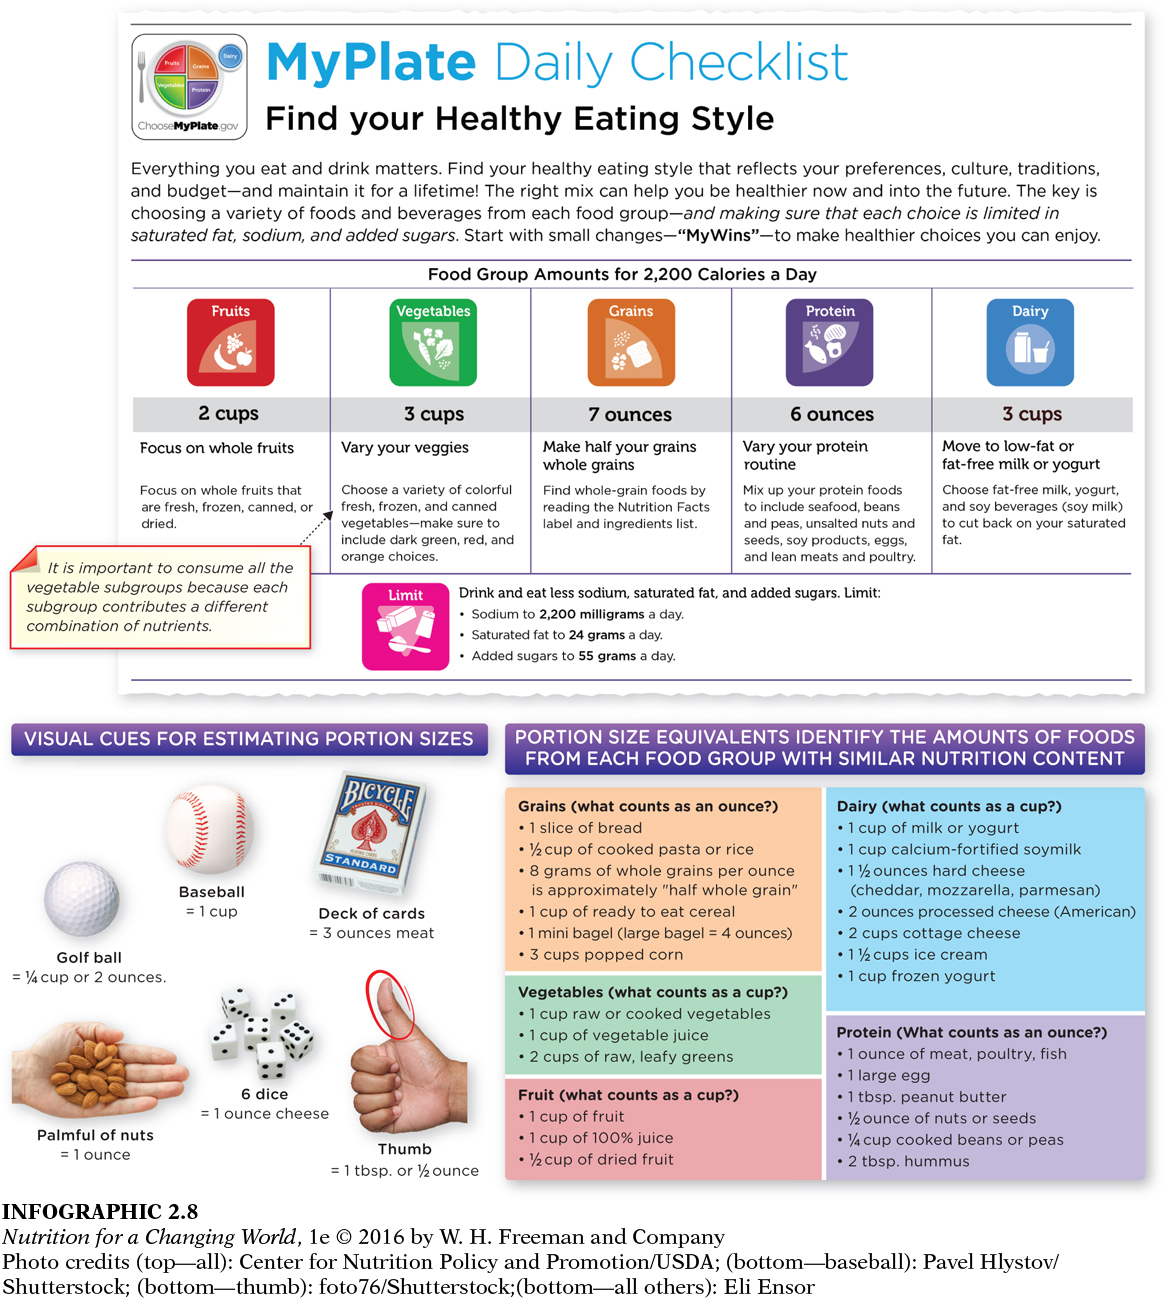
The food groups shown in the MyPlate graphic include fruits, grains, protein, vegetables and dairy. Vegetables are shown as slightly more than one-quarter of the plate, grains and protein each are shown as one-quarter of the plate, and fruits are shown as slightly less than one-quarter of the plate. Dairy is shown as a single serving to the side of the plate.
33
35
MyPlate is an illustration of a healthy meal on a “plate” divided into vegetables and fruits (slightly more vegetables than fruits), just under one-quarter lean protein sources, and just over one-quarter from grains (at least half of which should be whole grains). One serving of dairy is indicated in a serving off to the side—as a cup of milk or carton of yogurt. The website www.ChooseMyPlate.gov provides tips and tools for tracking and moderating the intake of calories, solid fats and added sugars, and more. This website is where you can access a personalized diet plan (My Daily Food Plan), with more detailed recommendations about specific foods to eat each day and each week that essentially mirror those recommendations found in the DGA. (INFOGRAPHIC 2.8)
34
Question 2.7
How much peanut butter counts as an ounce of protein? How would you estimate that quantity?
One tablespoon of peanut butter counts as one ounce of protein. It can be visualized as being the size of your thumb.
But none of this advice about healthy diets means anything to families who have little or no access to nutritious foods.
¦ ¦ ¦
In 2006, after spending months reviewing data from across Chicago, Gallagher found that more than 600,000 residents were in that very situation. They were living in food deserts—large, mostly poor areas with little or no access to grocery stores that sell healthy foods, including dairy, meat, and produce. And these residents, mostly African-Americans, were more likely to be obese and die prematurely from diabetes. The same pattern of disease was true even when Gallagher used statistical tools to remove the influence of race, income, education, and other factors that could affect health—independent of access to nutritious foods.
Soon after she released the report on her consulting company’s website and issued a press release, Gallagher was inundated by calls from the media; she talked about her research on CNN. “It was the starkness of the findings that caught everyone’s attention.”
She realized the problem wasn’t just in Chicago. In Birmingham, Alabama, she found that nearly 90,000 people live in food deserts, including more than 20,000 children (INFOGRAPHIC 2.8)—and those who had equal or better access to stores that sell only unhealthy foods were more likely to lose years of their lives to diseases such as cancer and others linked to dietary causes. In Washington, D.C., she found that pregnant women who lived at least one half-mile from the nearest full-service grocery store were 10% more likely to give birth to an overweight baby; when they lived at least one mile from a grocery store that risk rose to 20%.
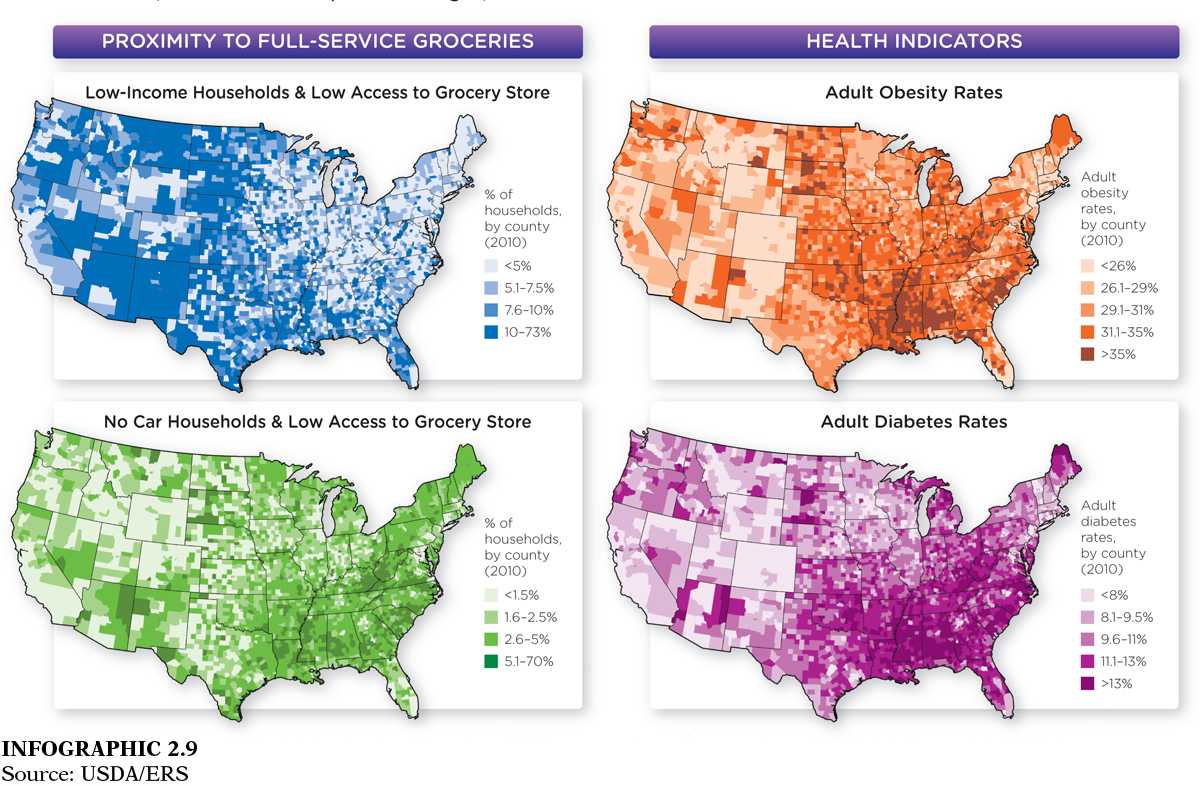
Question 2.8
What areas of the country have a high levels of diabetes and also obesity?
The southeastern United States has a large number of adults with diabetes and obesity.
In Pennsylvania, the entire city of Chester—with more than 34,000 residents—has not had a single full-service grocery store since 2001. “We have heard stories of a mom who had to get two taxicabs for her and her four kids to bring home all their bags from the grocery store,” says Marlo DelSordo of Philabundance, a local food bank and hunger relief organization. “She could only afford to go once or twice per month.”
The residents of food deserts were finding it impossible to eat nutrient-dense diets. “If you have to take a couple of buses to get a head of lettuce, it’s not feasible for you to eat a healthy diet,” says Gallagher.