EXAMPLE 13.20 Daily Trading Volume of FedEx
fedex
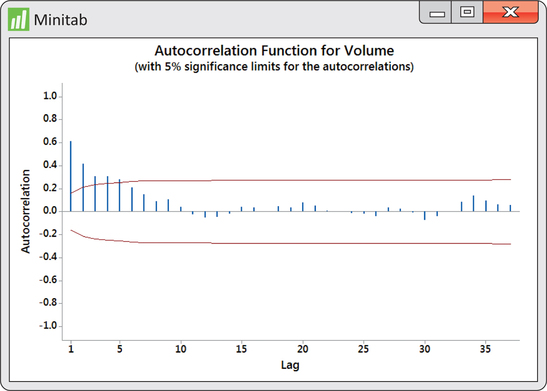
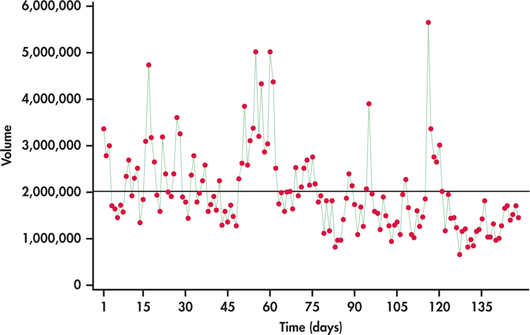
Investors and stock analysts are continually seeking ways to understand price movements in stocks. One factor many have considered in the prediction of price movements is trading volume—that is, the quantity of shares that change owners. In studying the relationship between trading volumes and price movements, an understanding of the trading-volume process becomes a source of interest. Are trading volumes random from trading period to trading period? Or is there some pattern in the trading volumes over time? Figure 13.35 is a time plot of daily trading volumes for FedEx stock from January 2 to August 4, 2014, with the mean trading volume indicated. It appears that there are “strings” of observations either all below or all above the mean. With these strings, we see that if an observation is below (above) the mean, then the next observation quite often will also be below (above) the mean. The ACF of the volumes shown in Figure 13.36 confirms that the series exhibits nonrandom behavior.
683