EXAMPLE 13.26 Great Lakes water Levels
lakes
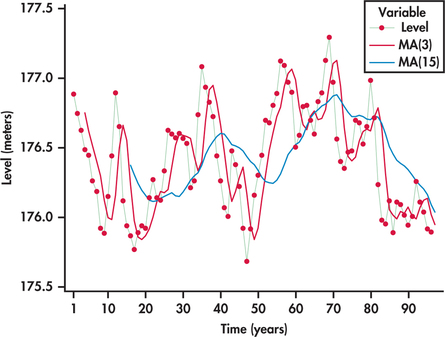
Consider again the annual average water levels of Lakes Michigan and Huron studied in Example 13.23 (page 687). Figure 13.45 displays moving-average one-step ahead forecasts based on a span of three years and moving averages based on a span of 15 years.
The 15-year moving averages are much more smoothed out than the three-year moving averages. The 15-year moving averages provide a long-term perspective of the cyclic movements of the lake levels. However, for this series, the 15-year moving average model does not seem to be a good choice for short-term forecasting. Because the 15-year moving averages are “anchored” so many years into the past, this model tends to lag behind when the series shifts in another direction. In contrast, the three-year moving averages are better able to follow the larger ups and downs while smoothing the smaller changes in the time series.
The lake series has 96 observations ending with 2013. Here is the computation for the three-year moving-average forecast of the lake level for 2014: