EXAMPLE 13.34 Optimal Smoothing Constant for PMI Index Series
pmi
Figure 13.53 shows output from JMP and Minitab for the estimation of the optimal smoothing constant. JMP reports the value as 0.7953, and Minitab reports the value as 0.7908. The slight difference in these values is because the software applications use different procedures for estimating ARIMA parameters.
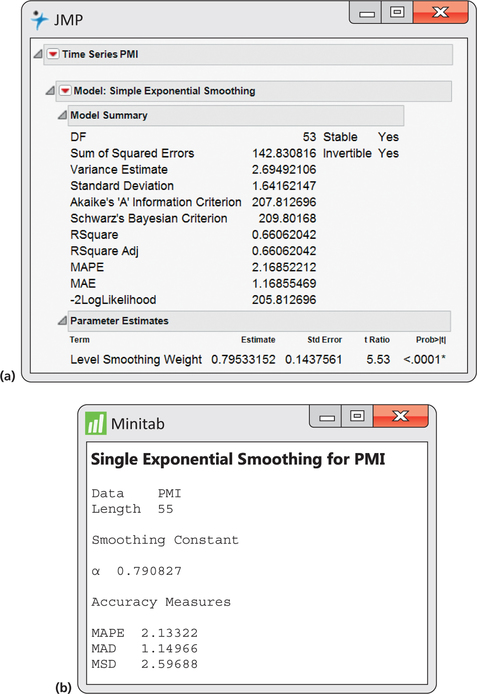
Figure 13.53: FIGURE 13.53 (a) JMP reported optimal smoothing constant; (b) Minitab reported optimal smoothing constant.