Figure 13.2:
FIGURE 13.2
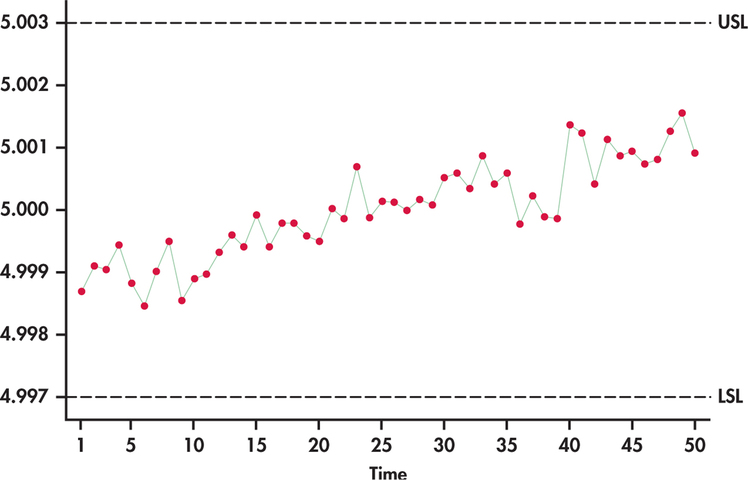
Time series plot of the 50 manufactured parts in order of manufacture along with tolerance limits.