Figure 13.50:
FIGURE 13.50
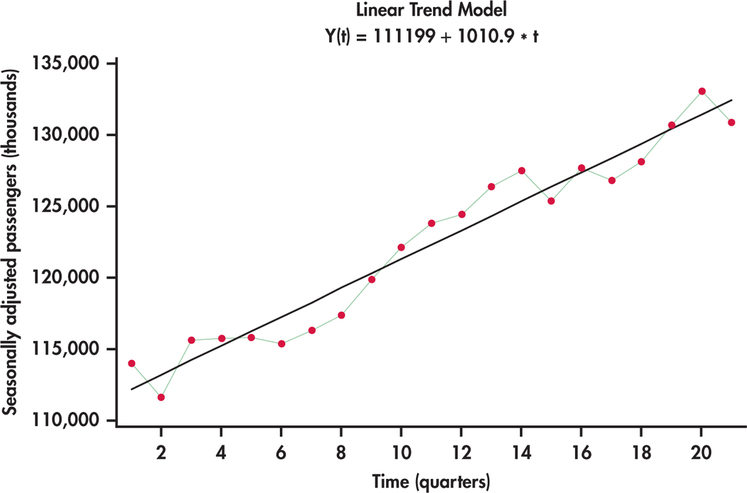
Seasonally adjusted light rail usage series along with linear trend fit.