Figure 13.40:
FIGURE 13.40
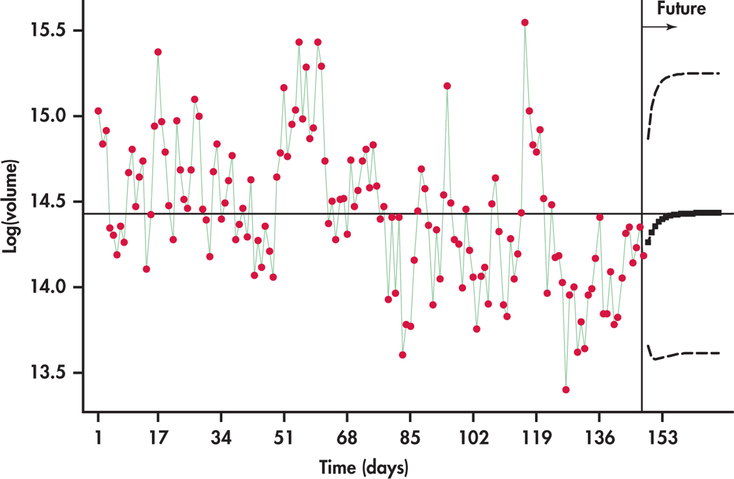
Time series plot of logged FedEx volumes with forecasts and prediction limits.