Figure 16.7:
FIGURE 16.7
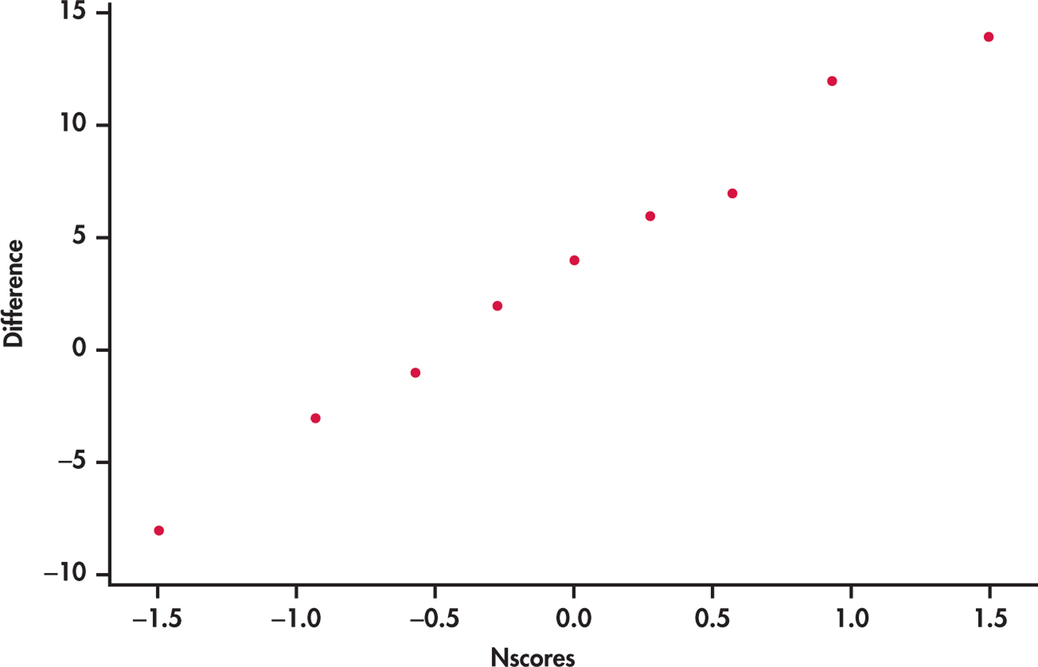
Normal quantile plot of the differences in loss of product value,
Example 16.7
.