Figure 16.8:
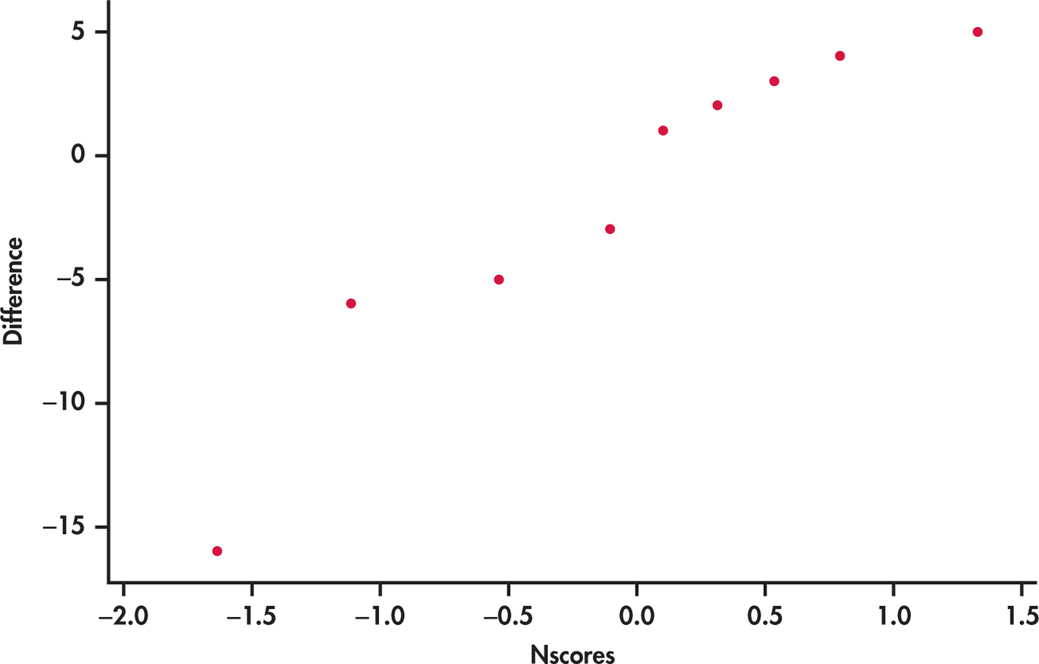
FIGURE 16.8
Normal quantile plot of the differences in scores for two rounds of a golf tournament,
Example 16.9
.