EXAMPLE 7.5 Estimating Mean Monthly Return
divrsfy
The mean monthly return on the client’s portfolio was , and the standard deviation was . Figure 7.6 gives the Minitab and SPSS outputs, and Figure 7.7 gives the Excel and JMP outputs for a 95% confidence interval for the population mean . Note that Excel gives the margin of error next to the label “Confidence Level(95.0%)” rather than the actual confidence interval. We see that the 95% confidence interval is (−3.04, 0.84), or (from Excel) .
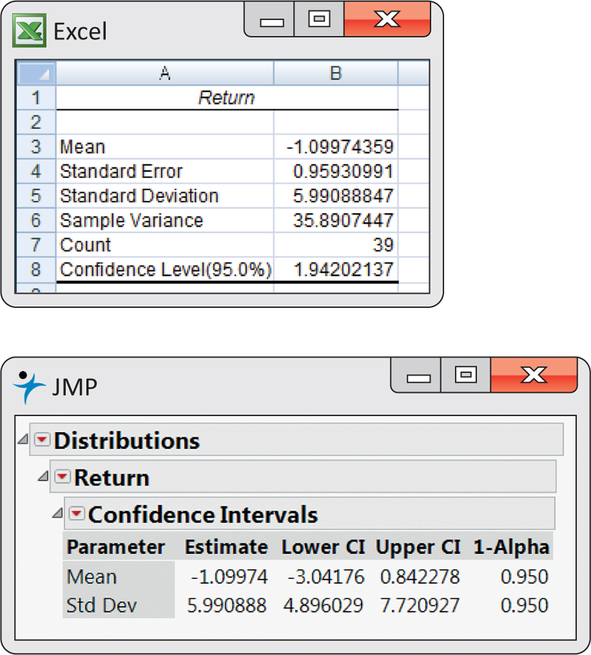
Figure 7.7: FIGURE 7.7 Excel and JMP outputs, Example 7.5.
Because the S&P 500 return, 0.95%, falls outside this interval, we know that differs significantly from 0.95% at the level. Example 7.4 gave the actual -value as .