Chapter 8 AppendixInference for Proportions with Excel, JMP, Minitab, SPSS, CrunchIt!, R, and TI-83-84 Calculators
TA8-1
Inference for One Proportion

Excel has no built-in functions for inference for one proportion. If this is your technology, you can compute a test statistic for a hypothesis test, and then use NORM.S. DIST from the Formulas ➔ Statistical menu to compute the -value.
For a video that shows how to use Excel and the formulas with an example, see the Excel Video Technology Manuals on One Proportion Inference: CI - Summarized Data and One Proportion Inference: Sample Size Computation.

Confidence Interval for One Proportion
- Help ➔ Sample Data ➔ Calculators ➔ Confidence Interval for One Proportion
- Select the input method (Raw Data or Summary Statistics). For almost all exercises and examples in this text, you will select “Summary Statistics.” For a plus four interval, simply add 2 to the number of successes and 4 to the number of trials/samples.
- Enter the number of successes, the sample size (n), and the confidence level in the boxes.
Note: Confidence intervals and hypothesis testing for a proportion with raw data can also be found in the Analyze ➔ Distribution platform.
For a video that shows how to use JMP here with an example, see the JMP Video Technology Manuals on One Proportion Inference: CI - Summarized Data and One Proportion Inference: Sample Size Computation.
Test for One Proportion
- Help ➔ Sample Data ➔ Calculators ➔ Hypothesis Test for One Proportion
- Select the input method (“Raw Data” or “Summary Statistics”). For almost all exercises and examples in this text, you will select “Summary Statistics.”
- Select the form of the alternate hypothesis (not equal, greater than, or less than), and enter the hypothesized value of the proportion, the number of “successes,” the sample size, and the significance level of the test. Press “Enter.”
- If you desire, check the box labeled “Reveal Decision.” A Reject/Fail to Reject message will appear below the -value of the test at the lower right.
For an example, see the JMP Video Technology manual One Proportion Inference: CI and test - raw data.
TA8-2

Confidence Interval and Tests for One Proportion
Confidence intervals and tests are done from the same dialog box regardless of whether you have raw data (in a column) or only summary statistics.
- Click Stat ➔ Basic Statistics ➔ 1 Proportion
- Change the drop-down at the top to reflect whether you have summary statistics (typical for this text) or raw data in a column.
- For raw data, highlight and select the column name into the box.
For summary statistics, enter the number of successes (x) and the sample size (n).
If you want a plus four interval, simply add 2 to the number of successes and 4 to the number of trials.
- The defaults are 95% confidence and a “not equal” alternate (two-sided confidence interval). To change either of these, click “Options,” change the value, then click “OK.”
- For the confidence interval, click “OK.”
- For a hypothesis test, check the box and enter the value of , then click “OK.”
For more information and an example, see the Minitab Video Technology Manual: One Proportion Inference: CI and Test: summarized data.

SPSS does not compute confidence intervals, hypothesis tests, or power for one proportion.
Note: See the SPSS technology manual for this chapter for instructions on using SPSS as a calculator to perform the tests and procedures above.

Both confidence intervals and hypothesis tests are done through the Statistics ➔ Proportion ➔ One-Sample dialog.
- For “raw data” in a column, click the “Columns” tab; otherwise (typically), click “Summarized.”
- For raw data, select the column of interest.
For summarized data, enter the sample size (n) and number of successes (x).
If you want a plus four interval, simply add 2 to the number of successes and 4 to the number of trials.
- Select the “Confidence Interval” tab and enter the desired confidence level, or
- Select the “Hypothesis Test” tab. Enter the hypothesized proportion value and type of alternate hypothesis.
- Click “Calculate.”
For more information (and an example), see the Crunchit! Help Video, Inference for One Proportion.
TA8-3

Confidence Interval for One Proportion
- Press
 to select “TEST.”
 - Select A:1-PropZInt.
- Enter the number of successes (x), the sample size (n), and the confidence level.
- Select “Calculate.”
Test for One Proportion
- Press
to select “TEST.”
- Select 5:1-PropZTest.
- Enter the value of the population proportion () under the null hypothesis, the number of successes (x), and the sample size (n).
- Select the desired type of alternative hypothesis.
- Select “Calculate.”
For more help and an example, see the TI-83/-84 Video Technology Manuals, One Proportion Inference: CI - summarized data and One Proportion Inference: Sample Size Computation.

R does not have a built-in function to perform a test for one proportion. There is a prop.test command, but it uses the chi-square distribution; its -values and confidence intervals will be different than those found using a distribution.
For an example using R (as a calculator here), see the R Video Technology Manual: One Proportion Inference: Confidence Intervals. (The part you are interested in is at the end.)
Inference for Two Proportions
Excel has no built-in functions for inference for two proportions. If this is your technology, you can compute a test statistic for a hypothesis test, and then use NORM.S. DIST from the Formulas ➔ Statistical menu to compute the -value.
For a video that shows how to use Excel and the formulas with an example, see the Excel Video Technology Manual on Two Proportions Inference: CI and Test - summarized data.
Confidence Interval and Test for Two Proportions
Both of these can be done at once using the following steps:
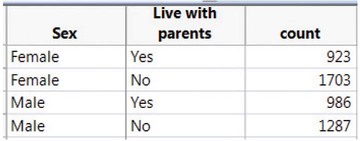
- Enter the data into the spreadsheet with one column for the “factor” variable (the category that distinguished the two proportions of interest), one column for the success/failure category names, and one for the counts. An example is below.
TA8-4
- Click Analyze ➔ Fit Y by X
- Select and enter the Response variable (the Yes/No variable), the Factor (the explanatory variable), and the counts as Weights.
- Click “OK.”
- Click on the red triangle at the top of the output. Select “Two-Sample Test for Proportions.” If necessary, change the response category of interest in that output.
- The default is 95% confidence. To change that, click the red triangle at the top of the output and select “Set a Level.”
If you want a plus four interval, simply add 1 to each number of successes and 2 to each number of trials.
For a video that shows how to use Excel and the formulas with an example, see the JMP Video Technology Manual on Two Proportions Inference: CI and Test - summarized data.
Confidence Interval and Tests for Two Proportions
Confidence intervals and tests are done from the same dialog box regardless of whether you have raw data (in columns) or only summary statistics.
- Click Stat ➔ Basic Statistics ➔ 2 Proportions
- Change the drop-down at the top to reflect whether you have summary statistics (typical for this text) or raw data in columns (and the data layout, if in columns—but this would be extremely rare for this text).
- For raw data, highlight and select the column name(s) into the box(es).
For summary statistics, enter the number of successes (x) and the sample size (n) for each sample.
If you want a plus four interval, simply add 1 to the number of successes and 2 to the number of trials for each sample
- Click “Options.” For a confidence interval, enter the level of confidence and select “Estimate the proportions separately” in the “Test Method” drop-down. For a hypothesis test, enter the type of alternate hypothesis and select “Use the pooled estimate of the proportion” in the Test Method drop-down.
- Click “OK” to return to the main dialog and “OK” for the results.
For a video that shows how to use Excel and the formulas with an example, see the Minitab Video Technology Manual on Two Proportion Inference: CI and Test - summarized data.
SPSS does not compute confidence intervals, hypothesis tests, or power for two proportions.
Note: See the SPSS technology manual for this chapter for instructions on using SPSS as a calculator to perform these.
TA8-5
Both confidence intervals and hypothesis tests are done through the Statistics ➔ Proportion ➔ Two-Sample dialog.
- For “raw data” in two columns, click the “Columns” tab. If you have raw data with one column indicating success/failure and a separate column for the explanatory variable, click “Grouped.” Otherwise (typically), click “Summarized.”
- For raw data, select the columns of interest and indicate the data value that represents a success.
For summarized data, enter the sample sizes (n) and number of successes (x).
If you want a plus four interval, simply add 1 to each number of successes and 2 to each number of trials.
- Select the “Confidence Interval” tab and enter the desired confidence level, or select the “Hypothesis Test” tab and enter the hypothesized proportion value and type of alternate hypothesis.
- Click “Calculate.”
For more information (and an example), see the Crunchit! Help Video, Inference for Two Proportions.
Confidence Interval for Two Proportions
- Press
to select “TEST.”
- Select B:2-PropZInt.
Enter the number of successes (x), the sample size (n) for each sample, and the confidence level.
If you want a plus four interval, simply add 1 to each number of successes and 2 to each number of trials.
- Select “Calculate.”
Test for Two Proportions
- Press
to select “TEST.”
- Select 6:2-PropZTest.
- Enter the number of successes (x) and the sample size (n) for each sample.
- Select the desired type of alternative hypothesis.
- Select “Calculate.”
For a video that shows how to use Excel and the formulas with an example, see TI-83/-84 Video Technology Manual: Two Proportion Inference: CI and Test - summarized data.
R does not have a built-in function to perform a test for two proportions. There is a prop.test command, but it uses the chi-square distribution; its -values and confidence intervals will be different than those found using a distribution.