Statistics for Quality: Control and Capability
591
CHAPTER OUTLINE
- 12.1 Statistical Process Control
- 12.2 Variable Control Charts
- 12.3 Attribute Control Charts
Introduction
For nearly 100 years, companies have benefited from a variety of statistical tools for the monitoring and control of their critical processes. But, in more recent years, companies have learned to integrate these statistical tools as a fundamental part of corporate management systems dedicated to continual improvement of their processes with the aims of delivering high-quality products and services at continually lower real costs.
- Health care organizations are using quality improvement methods to improve operations, outcomes, and patient satisfaction. The Mayo Clinic, John Hopkins Hospital, and New York-Presbyterian Hospital employ hundreds of quality professionals trained in Six-Sigma techniques. As a result of having these focused quality professionals, these hospitals have achieved numerous improvements ranging from reduced blood waste due to better control of temperature variation to reduced waiting time for treatment of potential heart attack victims.
- Acushnet company is the maker of Titleist golf balls, among the most popular brands used by professional and recreational golfers. To maintain consistency of the balls, Ascushnet relies on statistical process control methods to control manufacturing processes.
- Cree Incorporated is a market-leading innovator of LED (light-emitting diode) lighting. Cree's light bulbs were used to glow several venues at the Bejing Olympics and are being used in the nation's first LED-based highway lighting system in Minneapolis. Cree's mission is to continually improve upon its manufacturing processes so as to produce energy-efficient, defect-free, and environmentally friendly LEDs. To achieve high-quality processes and products, Cree generates a variety of control charts to display and understand process behaviors.
592
Quality overview
Moving into the twenty-first century, the marketplace signals were becoming clear: poor quality in products and services would not be tolerated by customers. Organizations increasingly recognized that what they didn't know about the quality of their products could have devastating results: customers often simply left when encountering poor quality rather than making complaints and hoping that the organization would make changes. To make matters worse, customers would voice their discontent to other customers, resulting in a spiraling negative effect on the organization in question. The competitive marketplace was pressuring organizations to leave no room for error in the delivery of products and services.
To meet these marketplace challenges, organizations have recognized that a shift to a different paradigm of management thought and action is necessary. The new paradigm calls for developing an organizational system dedicated to customer responsiveness and the quick development of products and services that at once combine exceptional quality, fast and on-time delivery, and low prices and costs. In the pursuit of developing such an organizational system, there has been an onslaught of recommended management approaches, including total quality management (TQM), continuous quality improvement (CQI), business process reengineering (BPR), business process improvement (BPI), and Six Sigma (). In addition, the work of numerous individuals has helped shape contemporary quality thinking. These include W. Edwards Deming, Joseph Juran, Armand Feigenbaum, Kaoru Ishikawa, Walter Shewhart, and Genichi Taguchi.1
Because no approach or philosophy is one-size-fits-all, organizations are learning to develop their own personalized versions of a quality management system that integrates the aspects of these approaches and philosophies that best suit the challenges of their competitive environments. However, in the end, it is universally accepted that any effective quality management approach must integrate certain basic themes. Four themes are particularly embraced:
- The modern approach to management views work as a process.
- The key to maintaining and improving quality is the systematic use of data in place of intuition or anecdotes.
- It is important to recognize that variation is present in all processes and the goal of an organization should be to understand and respond wisely to variation.
- The tools of process improvement—including the use of statistics and teams— are most effective if the organization's culture is supportive and oriented toward continuously pleasing customers.
process
The idea of work as a process is fundamental to modern approaches to quality, and even to management in general. A process can be simply defined as a collection of activities that are intended to achieve some result. Specific business examples of processes include manufacturing a part to a desired dimension, billing a customer, treating a patient, and delivering products to customers. Manufacturing and service organizations alike have processes. The challenge for organizations is to identify key processes to improve. Key processes are those that have significant impact on customers and, more generally, on organizational performance.
To know how a process is performing and whether attempts to improve the process have been successful requires data. Process improvement usually cannot be achieved by armchair reasoning or intuition. To emphasize the importance of data, quality professionals often state, “You can't improve what you can't measure.” Examples of process data measures include
593
- Average number of days of sales outstanding (finance/accounting).
- Time needed to hire new employees (human resources).
- Number of on-the-job accidents (safety).
- Time needed to design a new product or service (product/service design).
- Dimensions of a manufactured part (manufacturing).
- Time to generate sales invoices (sales and marketing).
- Time to ship a product to a customer (shipping).
- Percent of abandoned calls (call center).
- Downtime of a network (information technology).
- Wait times for patients in a hospital clinic (customer service)
Our focus is on processes common within an organization. However, the notion of a process is universal. For instance, we can apply the ideas of a process to personal applications such as cooking, playing golf, or controlling one's weight. Or we may consider broader processes such as a city's air pollution levels or crime rates. One of the great contributions of the quality revolution is the recognition that any process can be improved.
Systematic approach to process improvement
Management by intuition, slogans, or exhortation does not provide an environment or strategy conducive to process improvement. One of the key lessons of the quality revolution is that process improvement should be based on an approach that is systematic, scientific, and fact (data) based.
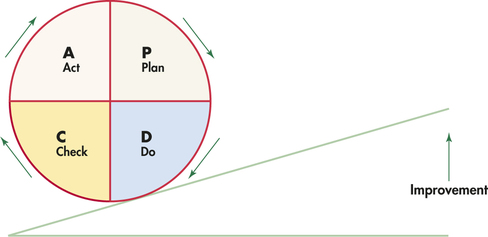
The systematic steps of process improvement involve identifying the key processes to improve, process understanding/description, root cause analysis, assessment of attempted improvement efforts, and implementation of successful improvements. The systematic steps for process improvement are captured in the Plan-Do-Check-Act (PDCA) cycle.
- The Plan step calls for identifying the process to improve, describing the current process, and coming up with solutions for improving the process.
- The Do step involves the implementation of the solution or change to the process; typically, improvements are first made on a small scale so as not to disrupt the routine activities of the organization.
- The Check step focuses on assessing post-intervention process data to see if the improvement efforts have indeed been successful.
- If the process improvement efforts are successful, the Act step involves the implementation of the process changes as part of the organization's routine activities.
Completion of these general steps represents one PDCA cycle. By continually initiating the PDCA cycle, continuous process improvement is accomplished, as depicted in Figure 12.1.
Advocates of the Six-Sigma approach emphasize that the Six-Sigma improvement model distinguishes itself from other process improvement models in that it calls for projects to be selected only if they are clearly linked to business priorities. This means that projects not only must be linked to customers' needs, but also must have a significant financial impact seen in the bottom line. Organizations pursuing process improvement as part of a Six-Sigma effort use a tailored version of the generic PDCA improvement model known as Define-Measure-Analyze-Improve-Control (DMAIC).
594
- In the Define phase, the goal is to clearly identify an improvement opportunity in measurable terms and establish project goals.
- In the Measure phase, data are gathered to establish the current process performance.
- In the Analyze phase, efforts are made to find the sources (root causes) of less-than-desirable process performance. In many applications, root cause analysis relies on performing appropriately designed experiments and analyzing the resulting data using statistical techniques such as analysis of variance (Chapter 14) and multiple regression (Chapter 11).
- In the Improve phase, solutions are developed and implemented to attack the root causes.
- In the Control phase, process improvements are institutionalized, and procedures and methods are put into place to hold the process in control so as to maintain the gains from the improvement efforts.
One of the most common statistical tools used in the Control phase is the control chart, which is the focus of this chapter.
Process improvement toolkit
Each of the steps of the PDCA and DMAIC improvement models can potentially make use of a variety of tools. The quality literature is rich with examples of tools useful for process improvement. Indeed, a number of statistical tools that we have already introduced in earlier chapters frequently play a key role in process improvement efforts. Here are some basic tools (statistical and nonstatistical) frequently used for process improvement efforts:
595
- Flowchart. A flowchart is a picture of the stages of a process. Many organizations have formal standards for making flowcharts. A flowchart can often jump-start the process improvement effort by exposing unexpected complexities (for example, unnecessary loops) or non-value-added activities (for example, waiting points that increase overall cycle time). Figure 12.2(a) is a flowchart showing the steps of an order fulfillment process for an electronic order from a customer.
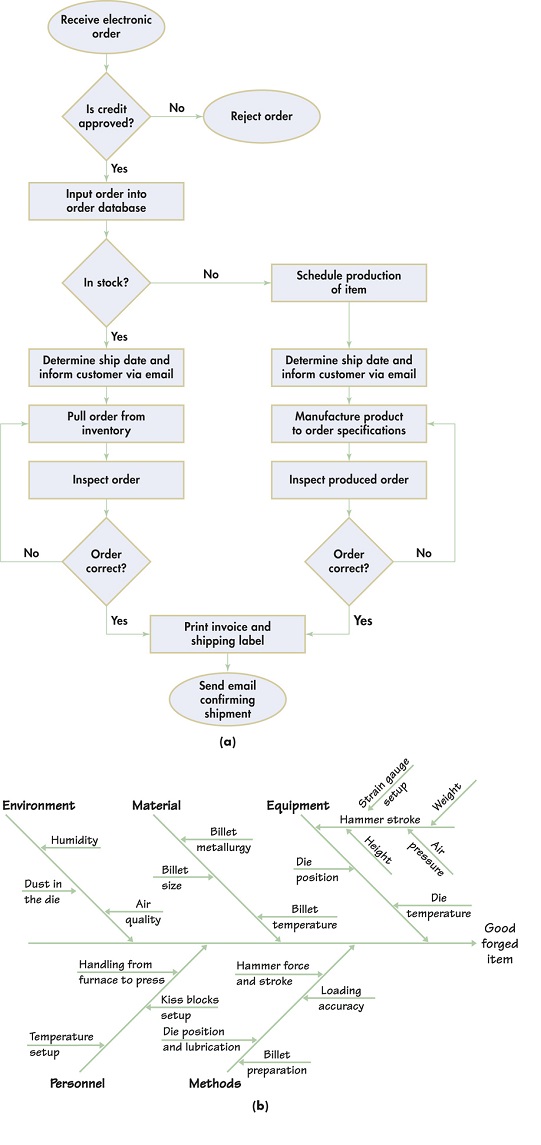 Figure 12.2: FIGURE 12.2 Examples of nonstatistical process improvement tools: (a) flowchart of an ordering process for an electronic order; (b) cause-and-effect diagram of hypothesized causes related to the making of a good forged item.
 - Run chart. A run chart is what quality professionals call a time plot. A run chart allows one to observe the performance of a process over time. For example, Motorola's service centers calculate mean response times each month and depict overall performance with a run chart.
Reminder

time plot, p. 19
- Histogram. Every process is subject to variability. The histogram is useful in process improvement efforts because it allows the practitioner to visualize the process behavior in terms of location, variability, and distribution. As we see in Section 12.2, histograms with superimposed product specification limits can be used to display “process capability.”
Reminder
histogram, p. 12
- Pareto chart. A Pareto chart is a bar graph with the bars ordered by height. Pareto charts help focus process improvement efforts on issues of greatest impact (“vital few”) as opposed to the less important issues (“trivial many”).
Reminder
Pareto chart, p. 10
- Cause-and-effect diagram. A cause-and-effect diagram is a simple visual tool used by quality improvement teams to show the possible causes of the quality problem under study. Figure 12.2(b) is a cause-and-effect diagram of the process of converting metal billets (ingots) into a forged item.2 Here, the ultimate "effect" is a good forged item. Notice that the main branches (Environment, Material, Equipment, Personnel, Methods) organize the causes and serve as a skeleton for the detailed entries. The main branches shown in Figure 12.2(b) apply to many applications and can serve as a general template for organizing thinking about possible causes. Of course, you are not bound to these branch labels. Once a list of possible causes is generated, they can be organized into natural main groupings that represent the main branches of the diagram. Looking at Figure 12.2(b), you can see why cause-and-effect diagrams are sometimes called fishbone diagrams.
- Scatterplot. The scatterplot can be used to investigate whether two variables are related, which might help in identifying potential root causes of problems.
Reminder
scatterplot, p. 65
- Control chart. A control chart is a time-sequenced plot used to study how a process changes over time. A control chart is more than a run chart in that control limits and a line denoting the average are superimposed on the plot. The control limits help practitioners determine if the process is consistent with past behavior or if there is evidence that the process has changed in some way. This chapter is largely devoted to the control chart technique.
596
Beyond the application of simple tools, there is an increasing use of more sophisticated statistical tools in the pursuit of quality. For example, the design of a new product as simple as a multivitamin tablet may involve interviewing samples of consumers to learn what vitamins and minerals they want included and using randomized comparative experiments (Chapter 3) to design the manufacturing process.
597
An experiment might discover, for example, what combination of moisture level in the raw vitamin powder and pressure in the tablet-forming press produces the right tablet hardness. In general, well-designed experiments reduce ambiguity about cause and effect and allow practitioners to determine what factors truly affect the quality of products and services. Let us now turn our attention to the area of statistical process control and its distinctive tool—the control chart.
Apply Your Knowledge
Question 12.1
12.1 Describe a process.
Consider the process of going from curbside at an airport to sitting in your assigned airplane seat. Make a flowchart of the process. Do not forget to consider steps that involve Yes/No outcomes.
Question 12.2
12.2 Operational definition and measurement.
If asked to measure the percent of late departures of an airline, you are faced with an unclear task. Is late departure defined in terms of “leaving the gate” or “taking off from the runway”? What is required is an operational definition of the measurement—that is, an unambiguous definition of what is to be measured so that if you were to collect the data and someone else were to collect the data, both of you would come back with the same measurement values. Provide an example of an operational definition for the following:
- Reliable mobile provider.
- Clean desk.
- Effective teacher.
Question 12.3
12.3 Causes of variation.
Consider the process of uploading a video to an Instagram account from a cell phone. Brainstorm as least five possible causes for variation in upload time. Construct a cause-and-effect diagram based on your identified potential causes.