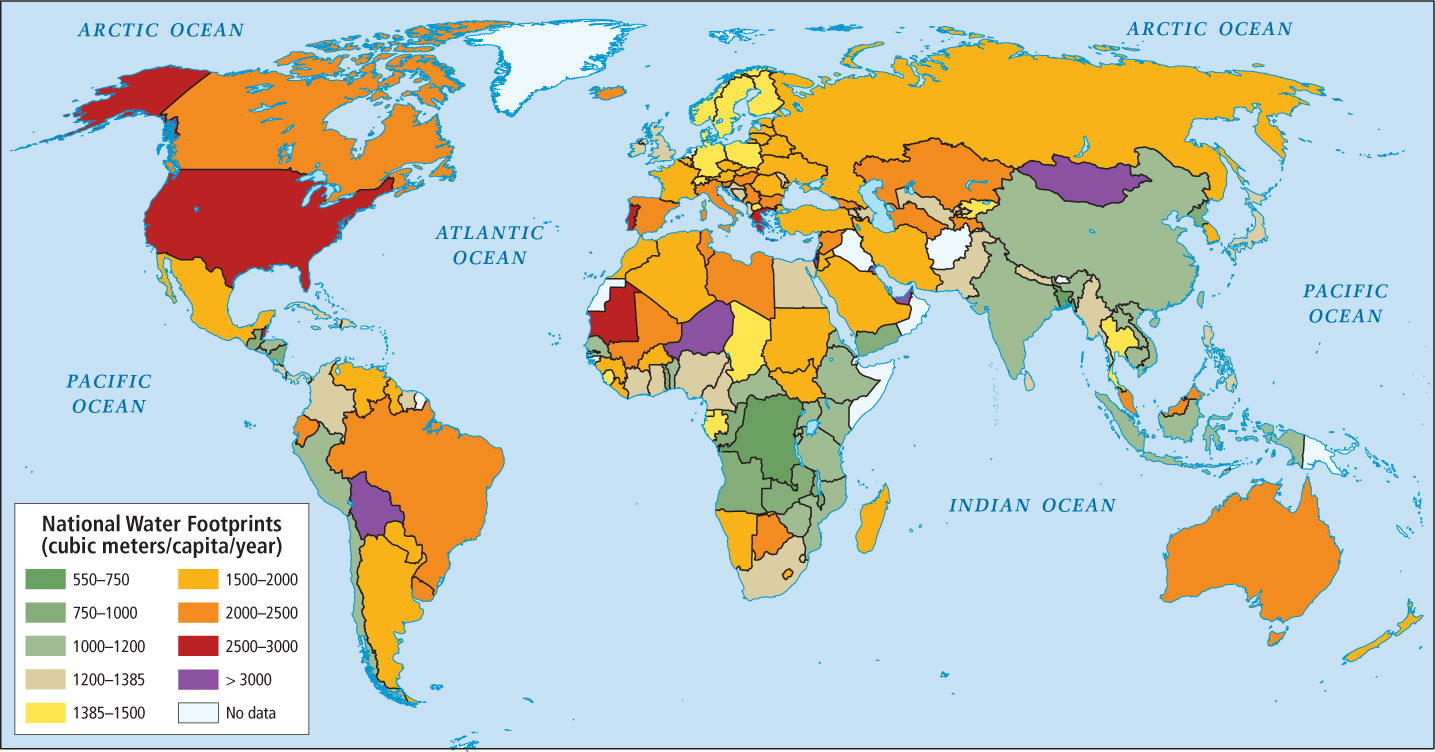
FIGURE 1.20 Map of national water footprints, 2005. Average national water footprint per capita (m3 per capita per year). The color green indicates that the nation’s water footprint is equal to or smaller than the global average. Countries in red have a water footprint beyond the global average. (The latest year for which data are available is 2005.)