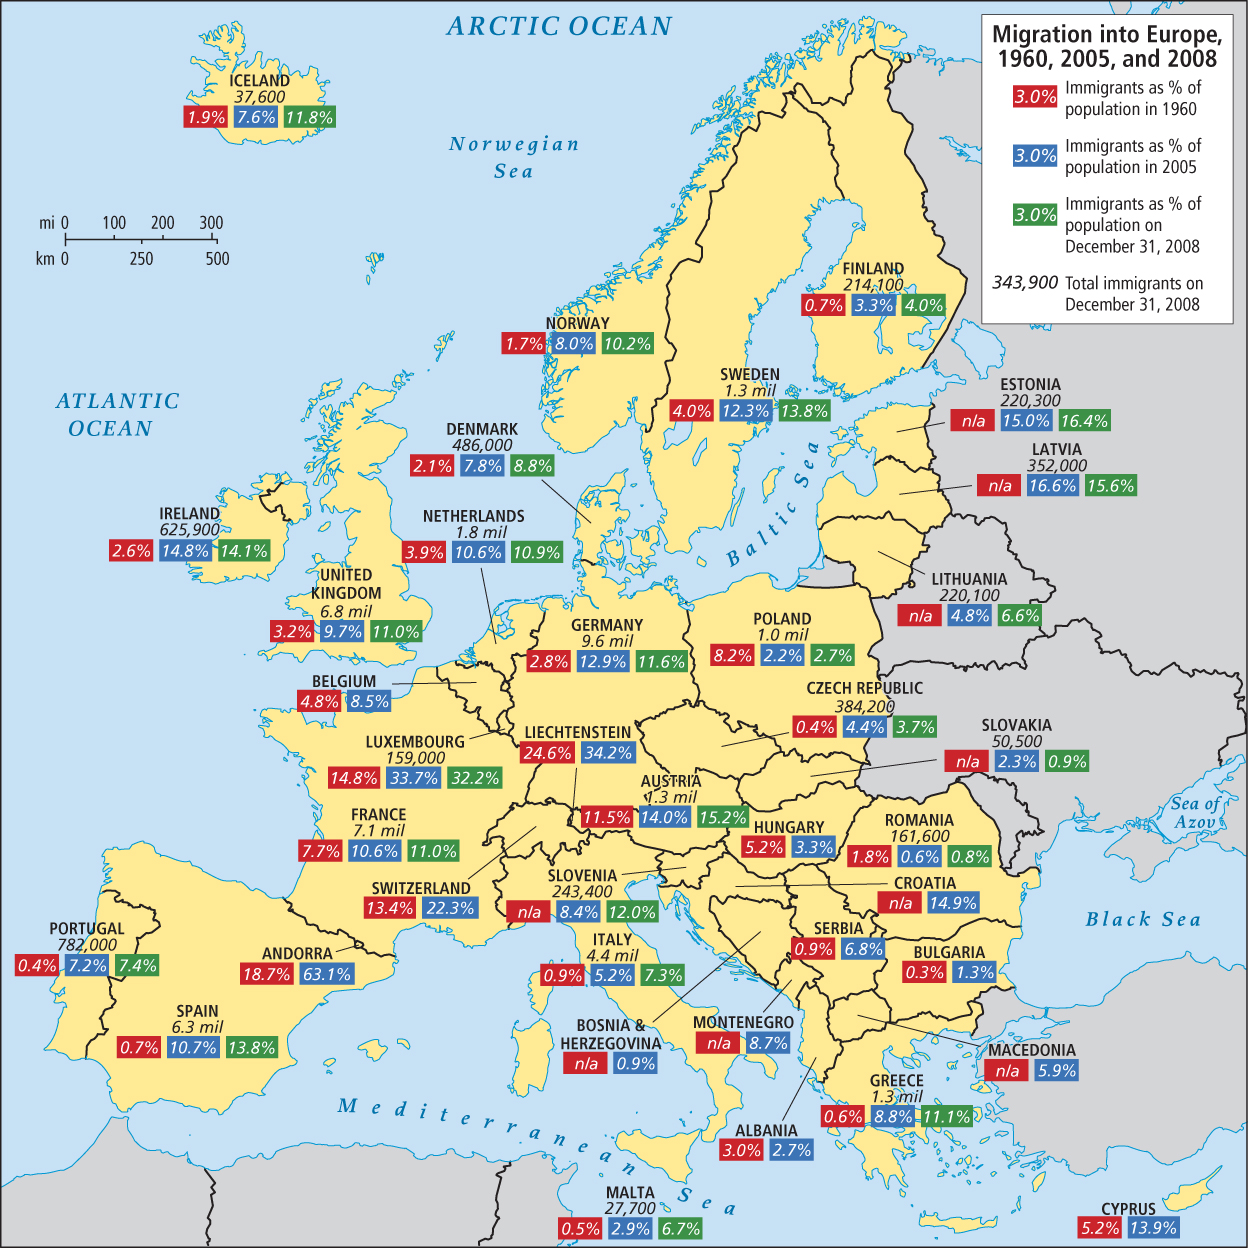
FIGURE 4.22 Migration into Europe, 1960, 2005, and 2008. Migration into Europe increased from 1960 through the 1990s and continued to increase into the twenty-first century for most countries. Migration continues to be a crucial issue in EU debates. The percentages of total population are shown in the three colored boxes for each country: the red box for 1960, the blue box for 2005, and the green box for 2008. The number of migrants living in each country at the end of 2008 is above the boxes.