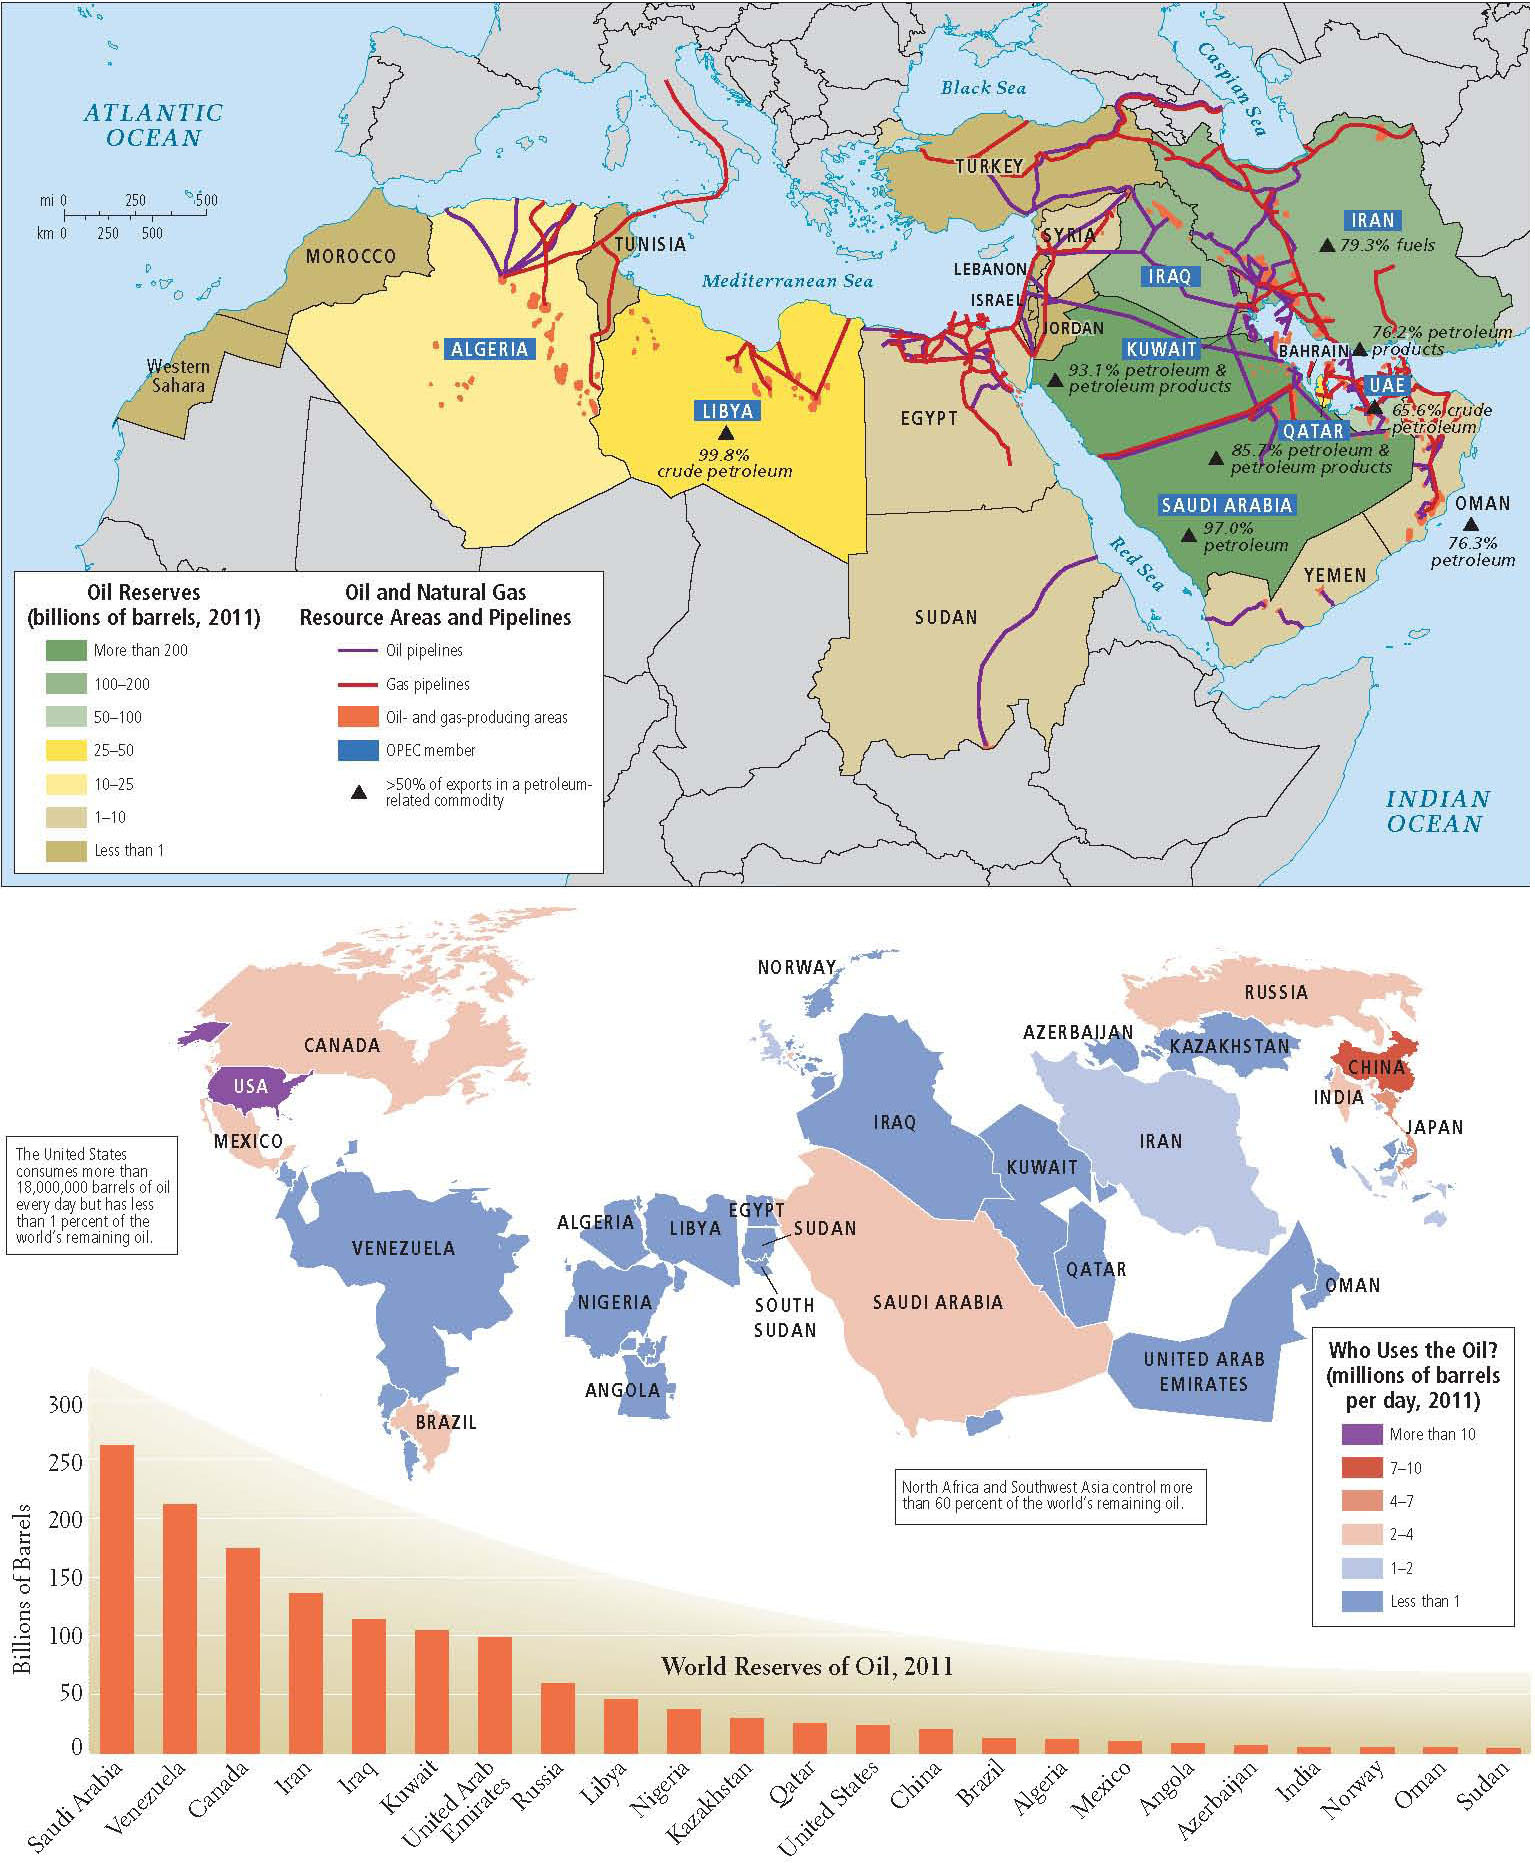
FIGURE 6.25 Economic issues: Oil and gas resources in North Africa and Southwest Asia. (A) This map shows oil reserves, oil and gas resource areas, and pipelines.
(B) This map contains a bar graph of oil reserves by country and a map in which the size of the countries corresponds to the amount of oil reserves held, and the color corresponds to the amount used.