1.2 Population
To study population is to study the growth and decline of numbers of people on Earth, their distribution across the Earth’s surface in terms of age and sex, as well as the reasons that prompt them to move. Over the last several hundred years, the global human population has boomed, but growth rates are now slowing in most societies and, in a few, have even begun to decline (a process that is also called negative growth). Much of this pattern has to do with changes in economic development and gender roles that have reduced incentives for large families.
Global Patterns of Population Growth
It took between 1 million and 2 million years (at least 40,000 generations) for humans to evolve and to reach a global population of 2 billion, which happened around 1945. Then, remarkably, in just 66 years—by October of 2011—the world’s population more than tripled to 7 billion (Figure 1.7). What happened to make the population grow so quickly in such a short time?
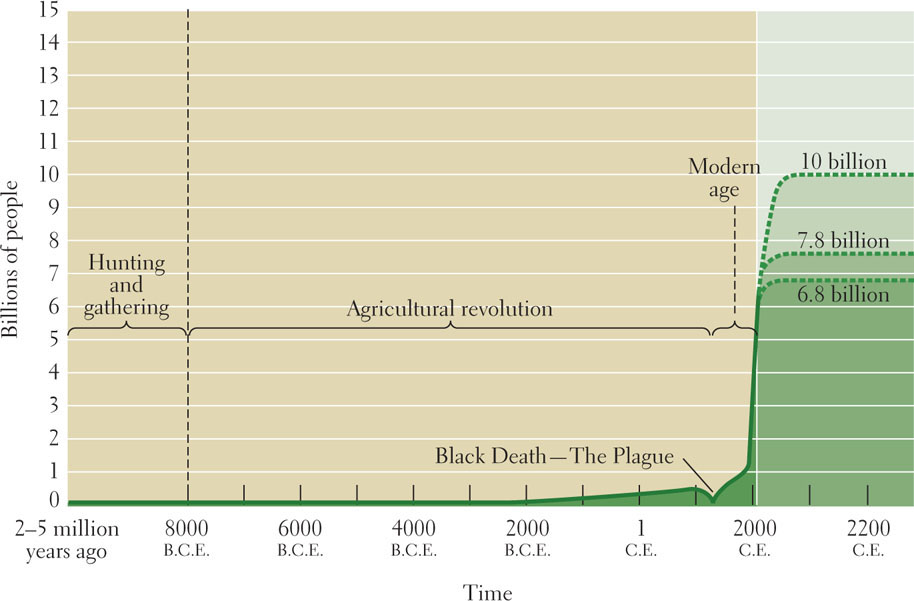
The explanation lies in changing relationships between humans and the environment. For most of human history, fluctuating food availability, natural hazards, and disease kept human death rates high, especially for infants. Out of many pregnancies, a couple might raise only one or two children. Also, pandemics, such as the Black Death in Europe and Asia in the 1300s, killed millions in a short time.
An astonishing upsurge in human population began about 1500, at a time when the technological, industrial, and scientific revolutions were beginning in some parts of the world. Human life expectancy increased dramatically, and more and more people lived long enough to reproduce successfully, often many times over. The result was an exponential pattern of growth (Figure 1.7). This pattern is often called a J curve because the ever-shorter periods between doubling and redoubling of the population cause an abrupt upward swing in the growth line when depicted on a graph.
13
Today, the human population is growing in most regions of the world, more rapidly in some places than in others. The reason for this growth is that currently a very large group of young people has reached the age of reproduction, and more will shortly join them. Nevertheless, the rate of global population growth is slowing. Since 1993 it has dropped from 1.7 percent per year to roughly 1.1 percent per year, which is where it stands today. If present slower growth trends continue, the world population may level off at between 7.8 billion and 10 billion before 2050. However, this projection is contingent on couples in less-developed countries having the education and economic security to choose to have smaller families and the ability to practice birth control using the latest information and technology.
In a few countries (especially Japan in Asia; and Russia and Ukraine plus Romania, Bulgaria, and Hungary in Central Europe), the population is actually declining and rapidly aging, due primarily to low birth and death rates. This situation could prove problematic, as those who are elderly and dependent become more numerous, posing a financial burden on a declining number of working-age people. HIV/AIDS is affecting population patterns to varying extents in all world regions. In Africa, the epidemic is severe; as a result, several African countries have sharply lowered life expectancies among young and middle-aged adults.  11. WORLD POPULATION TO BE CONCENTRATED IN DEVELOPING NATIONS, AS TOTAL EXPECTED TO REACH 9 BILLION BY 2050
Local Variations in Population Density and Growth
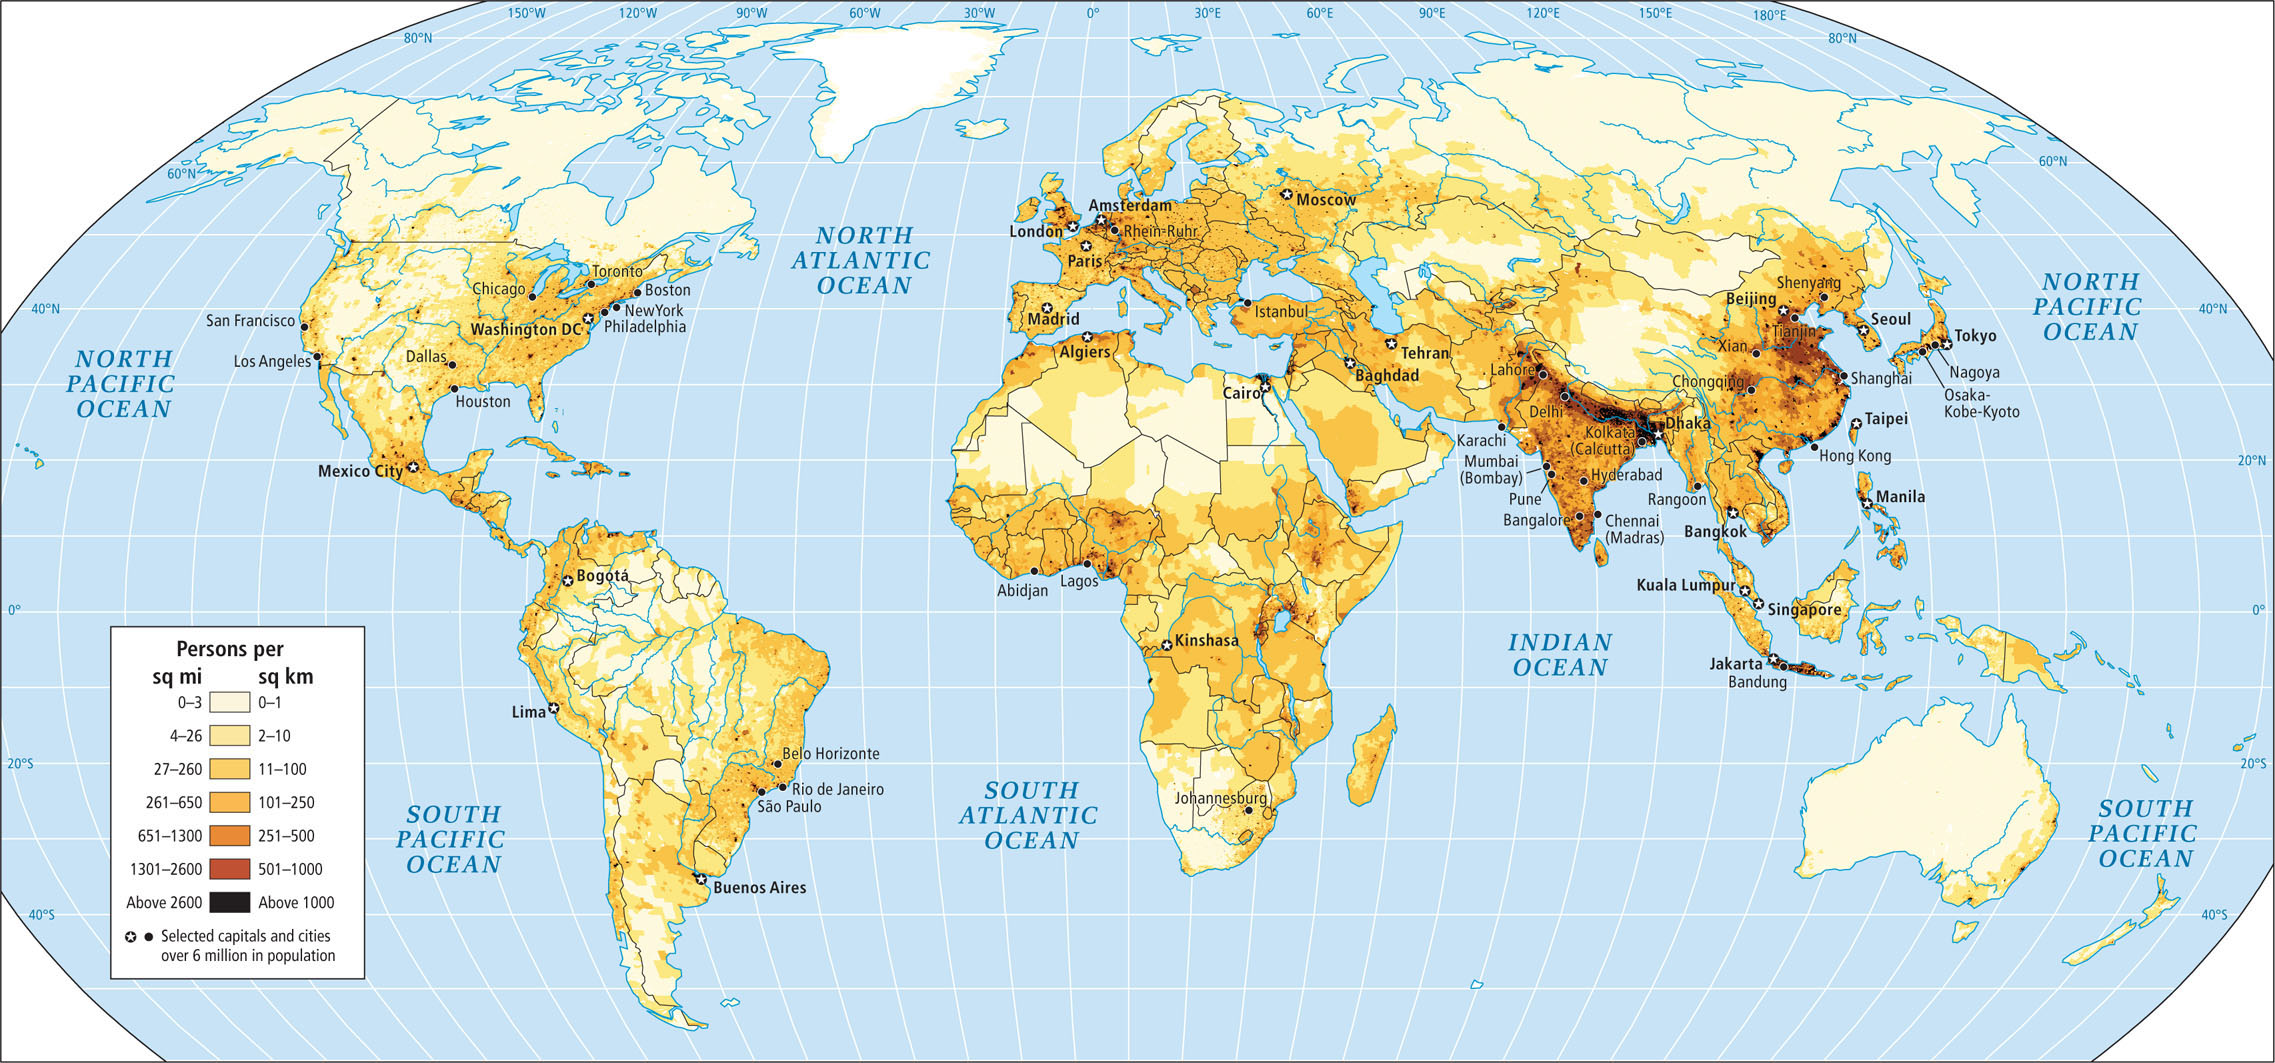
If the more than 7 billion people on Earth today were evenly distributed across the land surface, they would produce an average population density of about 121 people per square mile (47 per square kilometer). But people are not evenly distributed (Figure 1.8). Nearly 90 percent of all people live north of the equator, and most of them live between 20° N and 60° N latitude. Even within that limited territory, people are concentrated on about 20 percent of the available land. They live mainly in zones that have climates warm and wet enough to support agriculture: along rivers, in lowland regions, or fairly close to the sea. In general, people are located where resources are available.
Usually, the variable that is most important for understanding population growth in a region is the rate of natural increase (often called the growth rate). The rate of natural increase (RNI) is the relationship in a given population between the number of people being born (the birth rate) and the number dying (the death rate), without regard to the effects of migration (the movement of people from one place or country to another).
rate of natural increase (RNI) the rate of population growth measured as the excess of births over deaths per 1000 individuals per year without regard for the effects of migration
birth rate the number of births per 1000 people in a given population, per unit of time (usually per year)
death rate the ratio of total deaths to total population in a specified community, usually expressed in numbers per 1000 or in percentages
migration the movement of people from one place or country to another, often for safety or economic reasons
The rate of natural increase is expressed as a percentage per year. For example, in 2011, the annual birth rate in Austria (in Europe) was 9 per 1000 people, and the death rate was 9 per 1000 people. Therefore, the annual rate of natural increase was 0 per 1000 (9 − 9 = 0), or 0 percent.
For comparison, consider Jordan (in Southwest Asia). In 2011, Jordan’s birth rate was 31 per 1000, and the death rate was 4 per 1000. Thus the annual rate of natural increase was 27 per 1000 (31 − 4 = 27), or 2.7 percent per year. At this rate, Jordan’s population will double in just 29 years.
Total fertility rate (TFR), another term used to indicate trends in population, is the average number of children a woman in a country is likely to have during her reproductive years (15–49). The TFR (2011) for Austrian women is 1.4; for Jordanian women, it is 3.8. As education rates for women increase, and as they postpone childbearing into their late 20s, total fertility rates tend to decline.
total fertility rate (TFR) the average number of children that women in a country are likely to have at the present rate of natural increase
Another powerful contributor to population growth is immigration (in-migration). In Europe, for example, the rate of natural increase is quite low, but the region’s economic power attracts immigrants from throughout the world. Austria was attracting immigrants at the rate of 0.03 percent of its population in 2011, while Jordan was losing population to emigration (out-migration) at the rate of 0.04 percent of the population per year. In 2010, international migrants accounted for about 85 percent of the European Union’s population growth; they were important additions to the labor force in an era of declining births. All across the world people are on the move, seeking to improve their circumstances; often they are fleeing war, natural disasters, or economic recessions; understandably, developed countries are favored destinations.
immigration in-migration (see also migration)
emigration out-migration (see also migration)
14
Age and Sex Structures
Age and sex structures of a country’s population reflect past and present social conditions, and can help predict future population trends. The age distribution, or age structure, of a population is the proportion of the total population in each age group. The sex structure is the proportion of males and females in each age group.
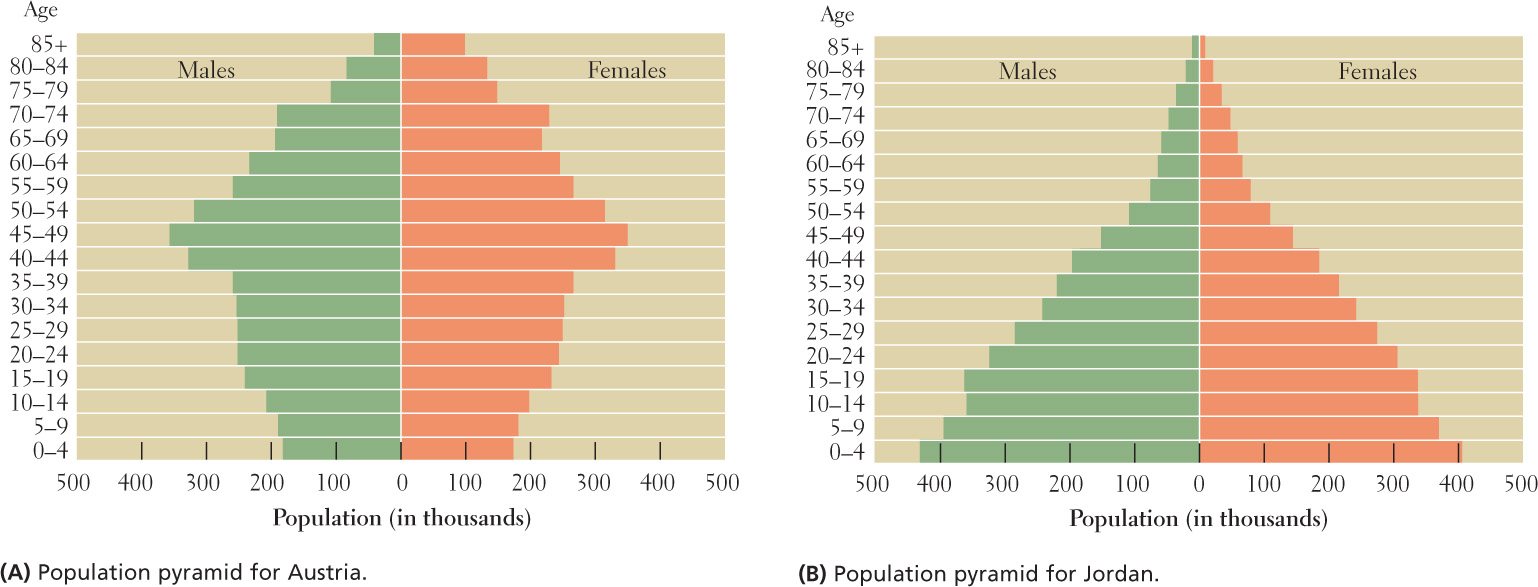
The population pyramid is a graph that depicts age and sex structures. Consider the population pyramids for Austria and Jordan (Figure 1.9). Notice that Jordan’s is a true pyramid with a wide bottom, and that the largest groups are in the age categories 0 through 14.
population pyramid a graph that depicts the age and gender structures of a political unit, usually a country
In contrast, Austria’s pyramid has an irregular vertical shape that tapers in toward the bottom. The base, which began to narrow rather relentlessly about 40 years ago, indicates that there are now fewer people in the youngest age categories than in the teen, young adulthood, or middle-age groups; those over 70 greatly outnumber the youngest (ages 0 to 4). This age distribution is due to two trends: many Austrians now live to an old age, and in the last several decades, Austrian couples have chosen to have only one child, or none. If these trends continue, Austrians will need to support and care for large numbers of elderly people, and those responsible will be an ever-declining group of working-age people.
Population pyramids also reveal sex imbalance within populations. Look closely at the right (female) and left (male) halves of the pyramids in Figure 1.9. In several age categories, the sexes are not evenly balanced on both sides of the line. In the Austria pyramid, there are more women than men near the top (especially in the age categories of 70 and older). In Jordan, there are more males than females near the bottom (especially ages 0 to 24).
15
Demographic research on the reasons behind statistical sex imbalance is relatively new, and many different explanations are proposed. In Austria, the predominance of elderly women reflects the fact that in countries with long life expectancies, women live about 5 years longer than men (a trend that is still poorly understood). But the sex imbalance in younger populations has different explanations. The normal ratio worldwide is for about 95 females to be born for every 100 males. Because baby boys on average are somewhat weaker than girls, the ratio normally evens out naturally within the first 5 years. However, in many places the ratio is as low as 80 females to 100 males, and continues throughout the life cycle. The widespread cultural preference for boys over girls (discussed in later chapters) becomes more observable as couples choose to have fewer children. Some fetuses, if identified as female, are purposely aborted; also, girls and women are sometimes fed less well and receive less health care than males, especially in poverty-stricken areas. Because of this, females are more likely to die, especially in early childhood. The gender imbalance of more males than females can be especially troubling for young adults, because the absence of females will mean that young men will find it hard to find a marriage mate.
Population Growth Rates and Wealth
Although there is a wide range of variation, regions with slow population growth rates usually tend to be affluent, and regions with fast growth rates tend to have widespread poverty. The reasons for this difference are complicated; again, Austria and Jordan are useful examples.
In 2011, Austria had an annual gross national income (GNI) per capita of $38,400 (PPP).1 This figure represents the total production of goods and services in a country in a given year, divided by the mid-year population; Austria’s is among the highest on Earth (the comparable figure for the United States is $45,640). Austria has a very low infant mortality rate of 3.7 per 1000. Its highly educated population is 100 percent literate, employed largely in technologically sophisticated industries and services. Large amounts of time, effort, and money are required to educate a child to compete in this economy. Many Austrian couples choose to have only one or two children, probably because of the cost of raising a child and because it is highly likely that children will survive to adulthood and thus will be available as companions for aging parents. Furthermore, the social welfare system in Austria ensures that citizens will not be impoverished in old age.
gross national income (GNI) per capita the total production of goods and services in a country in a given year divided by the mid-year population
16
By contrast, Jordan has a GNI (PPP) per capita of $5730 in addition to a high infant mortality rate of 23 per 1000. Much everyday work is still done by hand, so each new child is a potential contributor to the family income at a young age. There is little social welfare for elderly citizens and a much greater risk of children not surviving into adulthood. Having more children helps ensure that someone will be there to provide care for aging parents and grandparents.
Circumstances in Jordan, nonetheless, have changed rapidly over the last 25 years. In 1985, Jordan’s GNI per capita was less than $1900, infant mortality was 77 per 1000, and women had an average of 8 children. Now Jordanian women have an average of only 3.8 children, with the need to educate those children increasingly recognized. Geographers would say that Jordan is going through a demographic transition, meaning that a period of high birth and death rates is giving way to a period of much lower birth and death rates. In the middle phases, however, when death rates decline more rapidly than birth rates (Jordan’s death rate is just 4 per 1000 but its birth rate is 34 per 1000), population numbers can increase rapidly as attitudes toward optimal family size slowly adjust (see the green line in Figure 1.10). Populations may eventually stabilize but because of the lag in the lowering of birth rates, population numbers may be significantly higher than they were at the beginning of the transition.
demographic transition the change from high birth and death rates to low birth and death rates that usually accompanies a cluster of other changes, such as change from a subsistence to a cash economy, increased education rates, and urbanization
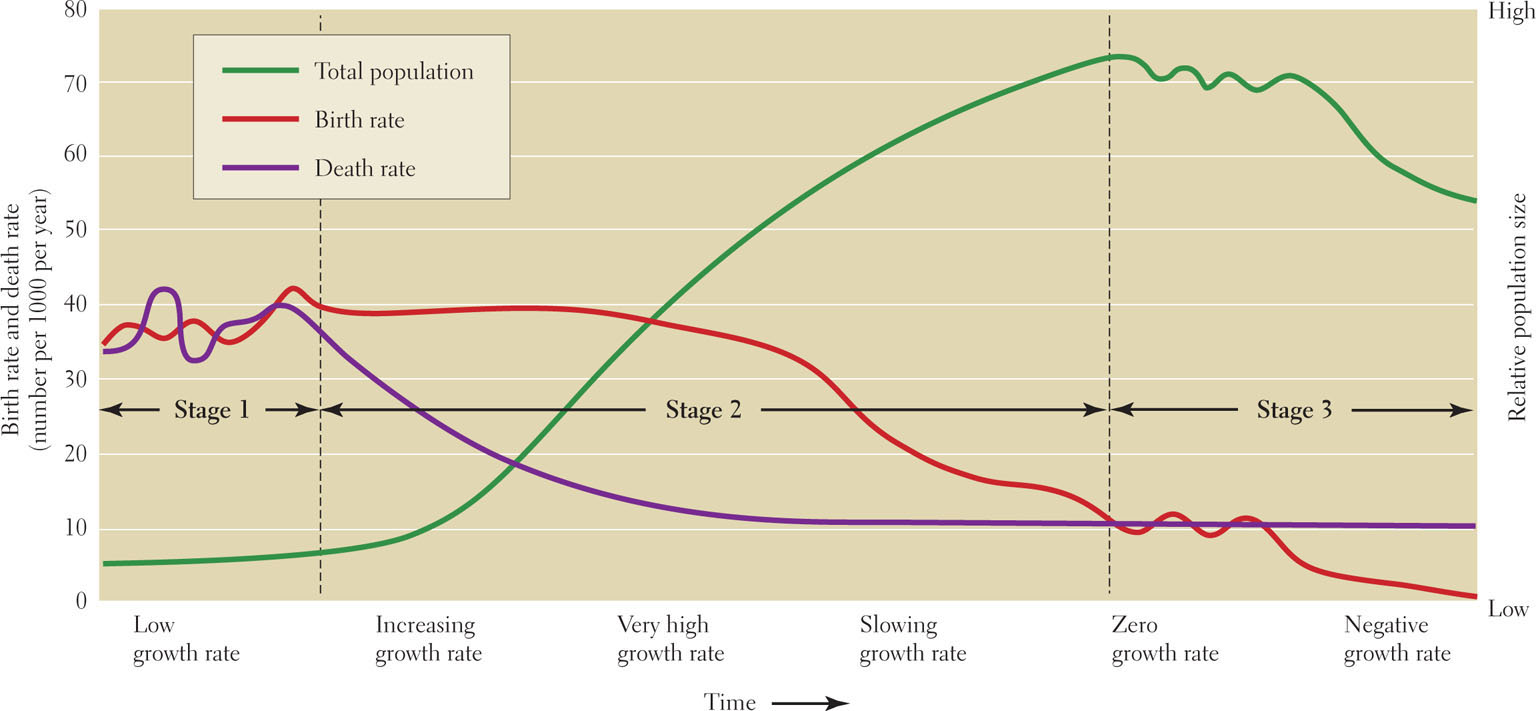
The demographic transition begins with the shift from subsistence to cash economies and from rural to urban ways of life. In a subsistence economy, a family, usually in a rural setting, produces most of its own food, clothing, and shelter, so there is little need for cash. Many children are needed to help perform the work that supports the family, so birth rates are high. Most needed skills are learned around the home, farm, and surrounding lands, so expensive educations at technical schools and universities are not needed. Today, subsistence economies are disappearing as people seek cash with which to buy food and goods such as television sets and bicycles. In a cash economy, which tends to be urban but may be rural, skilled workers, well-trained specialists, and even farm laborers are paid in money. Each child needs years of education to qualify for a good cash-paying job and does not contribute to the family budget while in school. Having many children, therefore, is a drain on the family’s resources. Perhaps most important, the higher development levels of cash economies mean those populations are more likely to have better health care, increasing the likelihood that each child will survive to adulthood.
17
subsistence economy an economy in which families produce most of their own food, clothing, and shelter
cash economy an economic system that tends to be urban but may be rural, in which skilled workers, well-trained specialists, and even farm laborers are paid in money
THINGS TO REMEMBER
 Over the last several hundred years, global population growth has been rapid. Although growth will continue for many years, rates are now slowing in most places and in a few places growth has reversed and the population is even shrinking.
- The circumstances that lead to lower population growth rates also lead to the overall aging of populations; these two phenomena are found nearly everywhere on Earth today, but to varying degrees.