1.1 Chapter 1 GEOGRAPHY: AN EXPLORATION OF CONNECTIONS
1
chapter 1
GEOGRAPHY: AN EXPLORATION OF CONNECTIONS▶
2
GEOGRAPHIC INSIGHTS
After you read this chapter, you will be able to discuss the following geographic insights as they relate to the five thematic concepts:
|
1. |
Environment: |
Humans are altering the planet at an unprecedented rate, causing sometimes drastic effects on ecosystems and climate. Multiple environmental factors often interact to influence the vulnerability of a location to the impacts of climate change. These vulnerabilities have a spatial pattern. |
|
2. |
Globalization and Development: |
Global flows of information, goods, and people are transforming patterns of economic development. Local self- |
|
3. |
Power and Politics: |
There are major differences across the world in the ways that power is wielded in societies. Modes of governing that are more authoritarian are based on the power of the state or community leaders. Modes that are based on notions of political freedom and democracy give the general public greater power over themselves and more of a role in deciding how policies are developed and governments are run. There are also many other ways of managing political power. |
|
4. |
Urbanization: |
The development of urban manufacturing and service economies has pulled people into cities. Meanwhile, the mechanization of food production has drastically reduced the need for agricultural labor, thus pushing people out of rural areas. |
|
5. |
Population and Gender: |
Population growth is slowing for a number of reasons, among them the increasing numbers of women who are delaying childbearing as they pursue educational and work opportunities outside the home. |
1.1.1 WHERE IS IT? WHY IS IT THERE? WHY DOES IT MATTER?
Where are you? You may be in a house or a library or sitting under a tree on a fine fall afternoon. You are probably in a community (perhaps a college or university), and you are in a country (perhaps the United States) and a region of the world (perhaps North America, Southeast Asia, or the Pacific). Why are you where you are? Some answers are immediate, such as “I have an assignment to read.” Other explanations are more complex, such as your belief in the value of an education, your career plans, and your or someone’s willingness to sacrifice to pay your tuition. Even past social movements that opened up higher education to more than a fortunate few may help explain why you are where you are.
The questions where and why are central to geography. Think about a time when you had to find the site of a party on a Saturday night, the location of the best grocery store, or the fastest and safest route home. You were interested in location, spatial relationships, and connections between the environment and people. Those are among the interests of geographers.
Geographers seek to understand why different places have different sights, sounds, smells, and arrangements of features. They study what has contributed to the look and feel of a place, to the standard of living and customs of the people, and to the way people in one place relate to people in other places. Furthermore, geographers often think on several scales, from the local to the global. For example, when choosing the best location for a new grocery store, a geographer might consider the physical characteristics of potential sites, the socioeconomic circumstances of the neighborhood, and traffic patterns locally and in the city at large, as well as the store’s location relative to the main population concentrations for the whole city. She would probably also consider national or even international transportation routes, possibly to determine cost-
To make it easier to understand a geographer’s many interests, try this exercise. Draw a map of your most familiar childhood landscape. Relax, and recall the objects and experiences that were most important to you there. If the place was your neighborhood, you might start by drawing and labeling your home. Then fill in other places you encountered regularly, such as your backyard, your best friend’s home, or your school. Figure 1.2 shows the childhood landscape remembered by Julia Stump in Franklin, Tennessee.
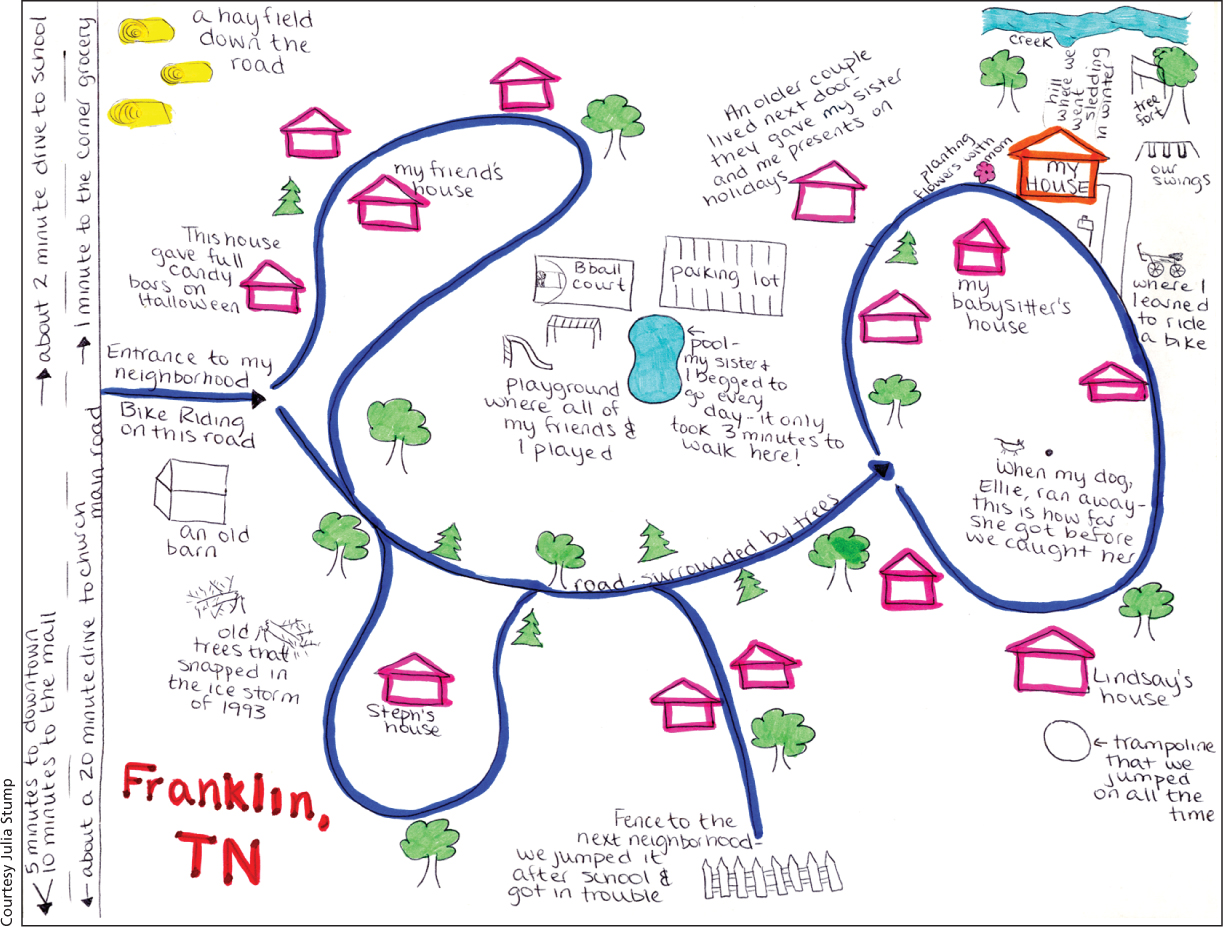
Consider how your map reveals the ways in which your life was structured by space. What is the scale of your map? That is, how much space did you decide to illustrate on the map? The amount of space your map covers may represent the degree of freedom you had as a child, or how aware you were of the world around you. Were there places you were not supposed to go? Does your map reveal, perhaps subtly, such emotions as fear, pleasure, or longing? Does it indicate your sex, your ethnicity, or the makeup of your family? Did you use symbols to show certain features? In making your map and analyzing it, you have engaged in several aspects of geography:
Landscape observation
Descriptions of the Earth’s surface and consideration of the natural environment
3
Spatial analysis (the study of how people, objects, or ideas are related to one another across space)
The use of different scales of analysis (your map probably shows the spatial features of your childhood at a detailed local scale)
Cartography (the making of maps)
As you progress through this book and this course, you will acquire geographic information and skills that will help you achieve your goals, whatever they are. If you want to travel or work outside your hometown or simply understand local events within the context of world events, knowing how to practice geography will make your task easier and more engaging.
1.1.2 WHAT IS GEOGRAPHY?
Physical and Human Geography
The primary concern of both physical and human geography is the study of the Earth’s surface and the interactive physical and human processes that shape the surface.
Geography is the study of our planet’s surface and the processes that shape it. Yet this definition does not begin to convey the fascinating interactions of human and environmental forces that have given the Earth its diverse landscapes and ways of life.
Geography as an academic discipline is unique in that it links the physical sciences—
physical geography the study of the Earth’s physical processes: how they work and interact, how they affect humans, and how they are affected by humans
human geography the study of patterns and processes that have shaped human understanding, use, and alteration of the Earth’s surface
How and why people came to occupy a particular place
How people use the physical aspects of that place (climate, landforms, and resources) and then modify them to suit their particular needs
How people may create environmental problems
How people interact with other places, far and near
4
Geographers usually specialize in one or more fields of study, or subdisciplines. Some of these particular types of geography are mentioned over the course of the book. Despite their individual specialties, geographers often cooperate in studying spatial interactions between people and places and the spatial distribution of relevant phenomena. For example, in the face of increasing global warming, climatologists, cultural geographers, and economic geographers work together to understand the spatial distribution of carbon dioxide emissions, as well as the cultural and economic practices that might be changed to limit such emissions. This could take the form of redesigning urban areas so that people can live closer to where they work or encouraging food production in locations closer to where the food will be consumed.
spatial interaction the flow of goods, people, services, or information across space and among places
spatial distribution the arrangement of a phenomenon across the Earth’s surface
Many geographers specialize in a particular region of the world, or even in one small part of a region. Regional geography is the analysis of the geographic characteristics of a particular place, the size and scale of which can vary radically. The study of a region can reveal connections among physical features and ways of life, as well as connections to other places. These links are key to understanding the present and the past, and are essential in planning for the future. This book follows a world regional approach, focusing on general knowledge about specific regions of the world. We will see just what geographers mean by region a little later in this chapter.
1.1.3 GEOGRAPHERS’ VISUAL TOOLS
Among geographers’ most important tools are maps, which they use to record, analyze, and explain spatial relationships, as you did on your childhood landscape map. Geographers who specialize in depicting geographic information on maps are called cartographers.
cartographers geographers who specialize in depicting geographic information on maps
Understanding Maps
A map is a visual representation of space used to record, display, analyze, and explain spatial relationships. Figure 1.3 explains the various features of maps.
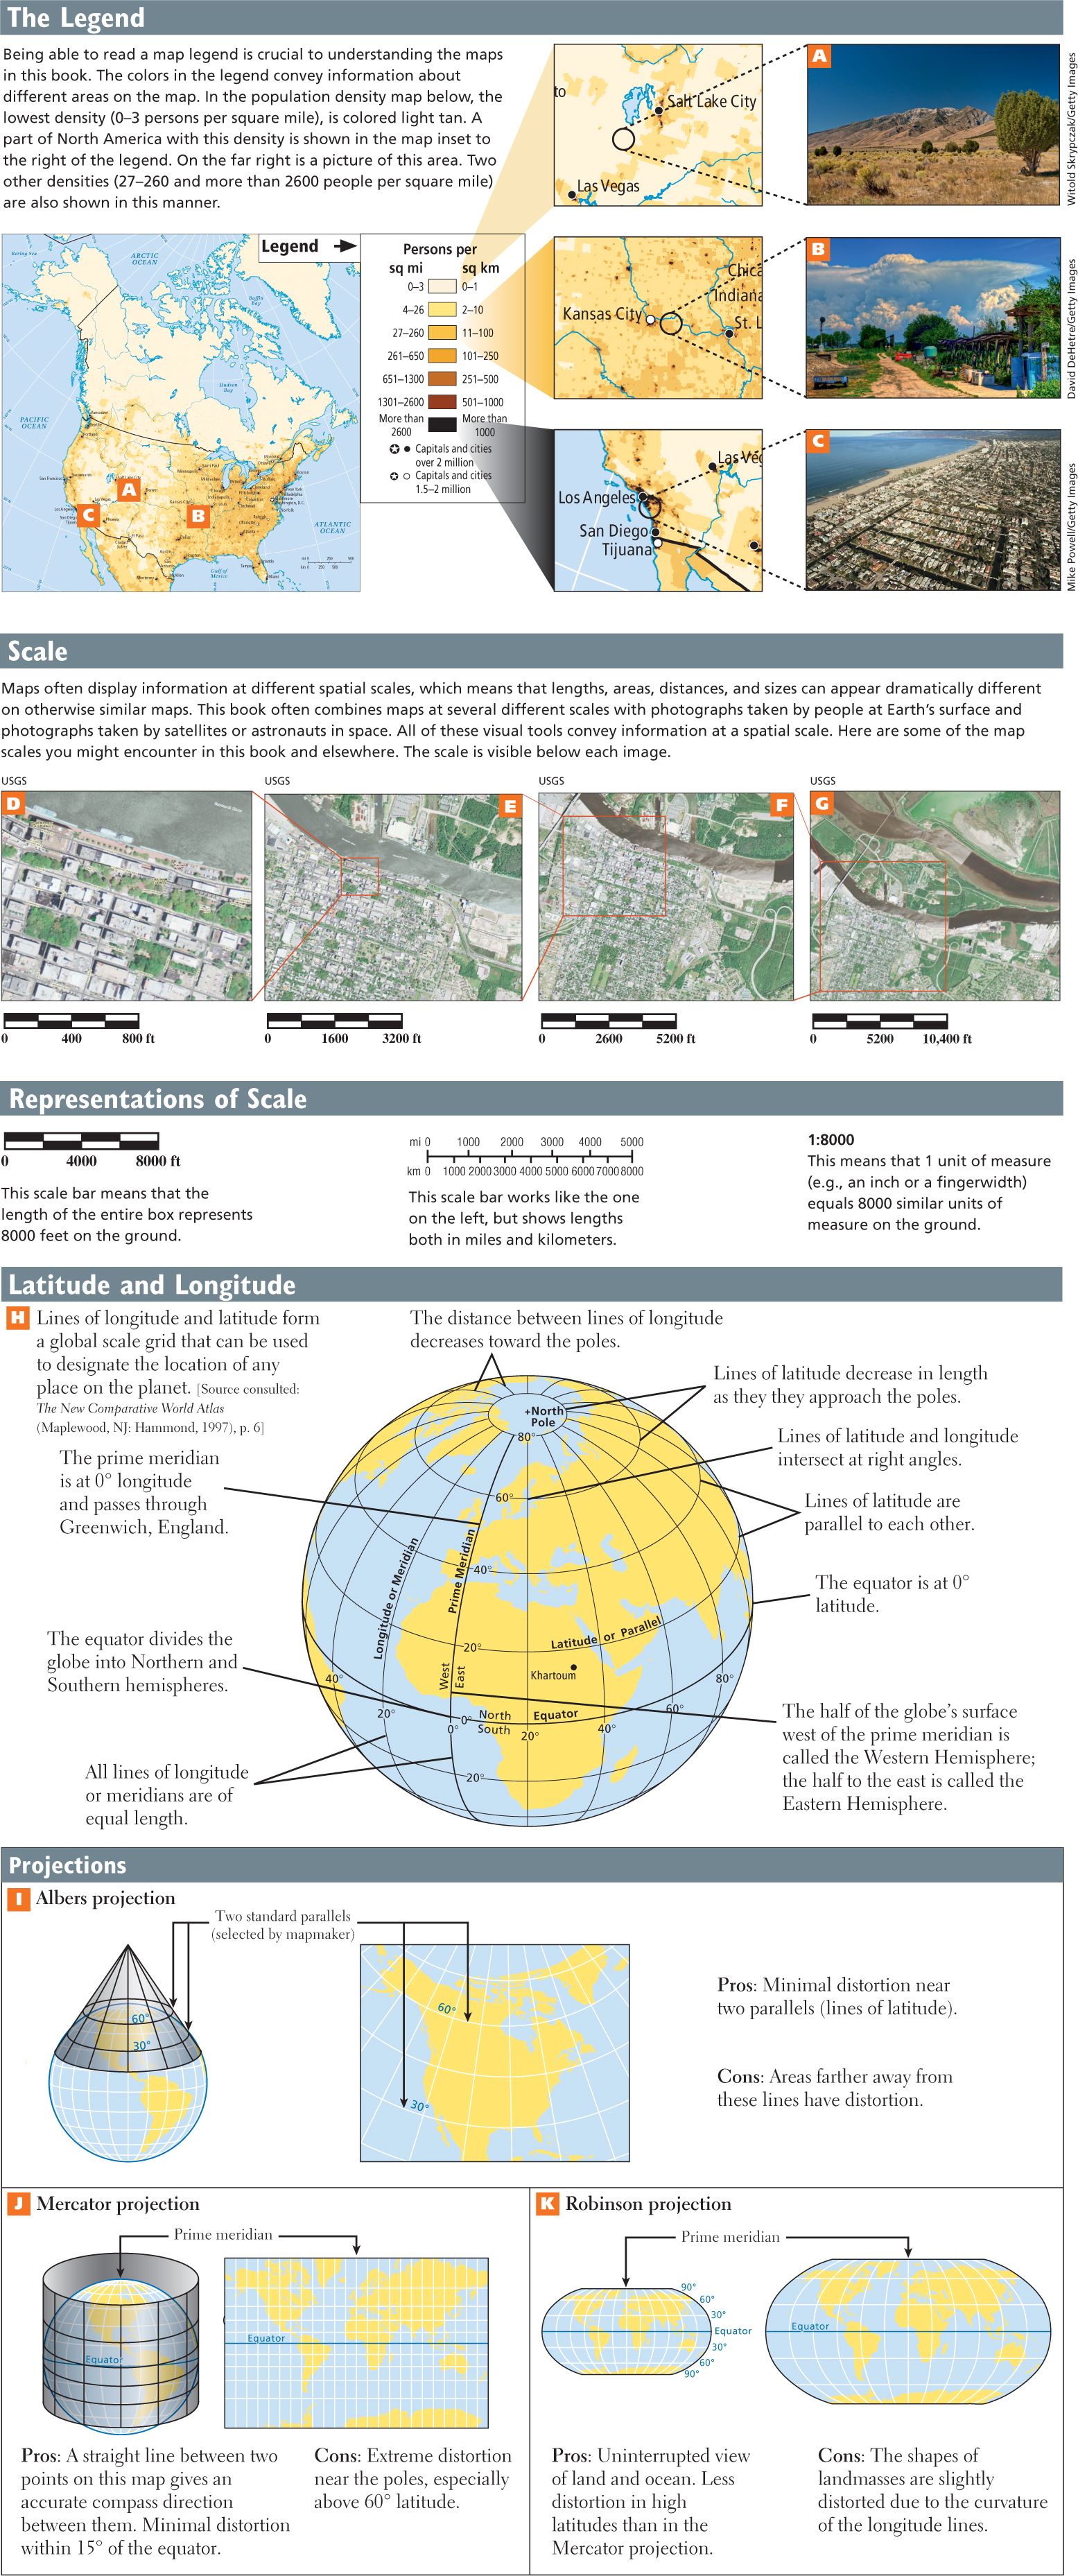
Legend and Scale The first thing to check on a map is the legend, which is usually a small box somewhere on the map that provides basic information about how to read the map, such as the meaning of the symbols and colors used (see parts A–
legend a small box somewhere on a map that provides basic information about how to read the map, such as the meaning of the symbols and colors used
In cartography, scale has a slightly different meaning than it does in general geographic analysis. Scale on a map refers to the relationship between the size of things on the map and the actual size they have on the surface of the Earth. It is usually represented by a scale bar (see Figure 1.3D–G) but is also sometimes represented by a ratio (for example 1:8000) or a fraction (1/8000), which indicates what one unit of measure on the map equals in the same units on the ground. For example, 1:8000 in. means that 1 inch on the map represents 8000 inches (about an eighth of a mile) on the surface of the Earth.
scale (of a map) the proportion that relates the dimensions of the map to the dimensions of the area it represents; also, variable-
A scale of 1/800 is considered larger than a scale of 1/8000 because the features on a 1/800 scale map are larger and can be shown in greater detail. The larger the scale of the map, the smaller the area it covers. A larger-
In Figure 1.3, different scales of imagery are demonstrated using maps, photographs, and satellite images. Read the captions carefully to understand the scale being depicted in each image. Throughout this book, you will encounter different kinds of maps at different scales. Some will show physical features, such as landforms or climate patterns at the regional or global scale. Others will show aspects of human activities at these same regional or global scales—
It is important to keep the two types of scales used in geography—
Longitude and Latitude Most maps contain lines of latitude and longitude, which enable a person to establish a position on the map relative to other points on the globe. Lines of longitude (also called meridians) run from pole to pole; lines of latitude (also called parallels) run around the Earth parallel to the equator (see Figure 1.3H).
longitude the distance in degrees east and west of Greenwich, England; lines of longitude, also called meridians, run from pole to pole (the line of longitude at Greenwich is 0° and is known as the prime meridian)
latitude the distance in degrees north or south of the equator; lines of latitude run parallel to the equator, and are also called parallels
Both latitude and longitude lines describe circles, so there are 360° (the symbol ° refers to degrees) in each circle of latitude and 180° in each pole-
5
6
7
The globe is also divided into hemispheres. The Northern and Southern hemispheres are on either side of the equator. The Western and Eastern hemispheres are defined as follows. The prime meridian, 0° longitude, runs from the North Pole through Greenwich, England, to the South Pole. The half of the globe’s surface west of the prime meridian is called the Western Hemisphere; the half to the east is called the Eastern Hemisphere. The longitude lines both east and west of the prime meridian are labeled from 1° to 180° by their direction and distance in degrees from the prime meridian. For example, 20 degrees east longitude would be written as 20° E. The longitude line at 180° runs through the Pacific Ocean and is used roughly as the international date line; the calendar day officially begins when midnight falls at this line.
The equator divides the globe into the Northern and Southern hemispheres. Latitude is measured from 0° at the equator to 90° at the North or South Poles.
Lines of longitude and latitude form a grid that can be used to designate the location of a place. In Figure 1.3H, notice the dot that marks the location of Khartoum below the 20th parallel in eastern Africa. The position of Khartoum is 15° 35′ 17″ N latitude by 32° 32′ 3″ E longitude.
Map Projections Printed maps must solve the problem of showing the spherical Earth on a flat piece of paper. Imagine drawing a map of the Earth on an orange, peeling the orange, and then trying to flatten out the orange-
map projections the various ways of showing the spherical Earth on a flat surface
For large midlatitude regions of the Earth that are mainly east/west in extent (North America, Europe, China, Russia), an Albers projection is often used. As you can see in Figure 1.3I, this is a conic, or cone-
The Mercator projection (see Figure 1.3J) has long been used by the general public, but geographers rarely use this projection because of its gross distortion near the poles. To make his flat map, the Flemish cartographer Gerhardus Mercator (1512–
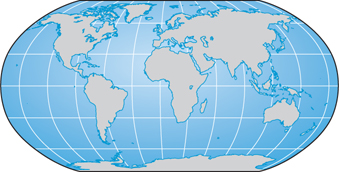
The Robinson projection (see Figure 1.3K) shows the longitude lines bending toward the poles to give an impression of the Earth’s curvature, and it has the advantage of showing an uninterrupted view of land and ocean; however, as a result, the shapes of landmasses are slightly distorted. In this book we often use the Robinson projection for world maps.
Maps are not unbiased. Most currently popular world map projections reflect the European origins of modern cartography. For example, Europe or North America is often placed near the center of the map, where distortion is minimal; other population centers, such as East Asia, are placed at the highly distorted periphery. For a less-
Geographic Information Science (GISc)
The acronym GISc is now widespread and usually refers to Geographic Information Science, the body of science that supports spatial analysis technologies. GISc is multidisciplinary, using techniques from cartography (mapmaking), geodesy (measuring the Earth’s surface), and photogrammetry (the science of making reliable measurements, especially by using aerial photography). Other sciences, such as cognitive psychology and spatial statistics (geomatics or geoinformatics), are increasingly being used to give greater depth and breadth to three-
Geographic Information Science (GISc) the body of science that supports multiple spatial analysis technologies and keeps them at the cutting edge
GISc is a burgeoning field in geography, with wide practical applications in government and business and in efforts to assess and improve human and environmental conditions. GIS (without the c) is an older term that refers to geographic information systems and is applied to the computerized analytical systems that are the tools of this newest of spatial sciences.
The now widespread use of GISc, particularly by governments and corporations, has dramatically increased the amount of information that is collected and stored, and changed the way it is analyzed and distributed. These changes create many new opportunities for solving problems, for example, by increasing the ability of local governments to plan future urban growth. However, these technologies also raise serious ethical questions. What rights do people have over the storage, analysis, and distribution of information about their location and movements, which can now be gathered from their cell phones? Should this information reside in the public domain? Should individuals have the right to have their location-
8
1.1.4 THE DETECTIVE WORK OF PHOTO INTERPRETATION
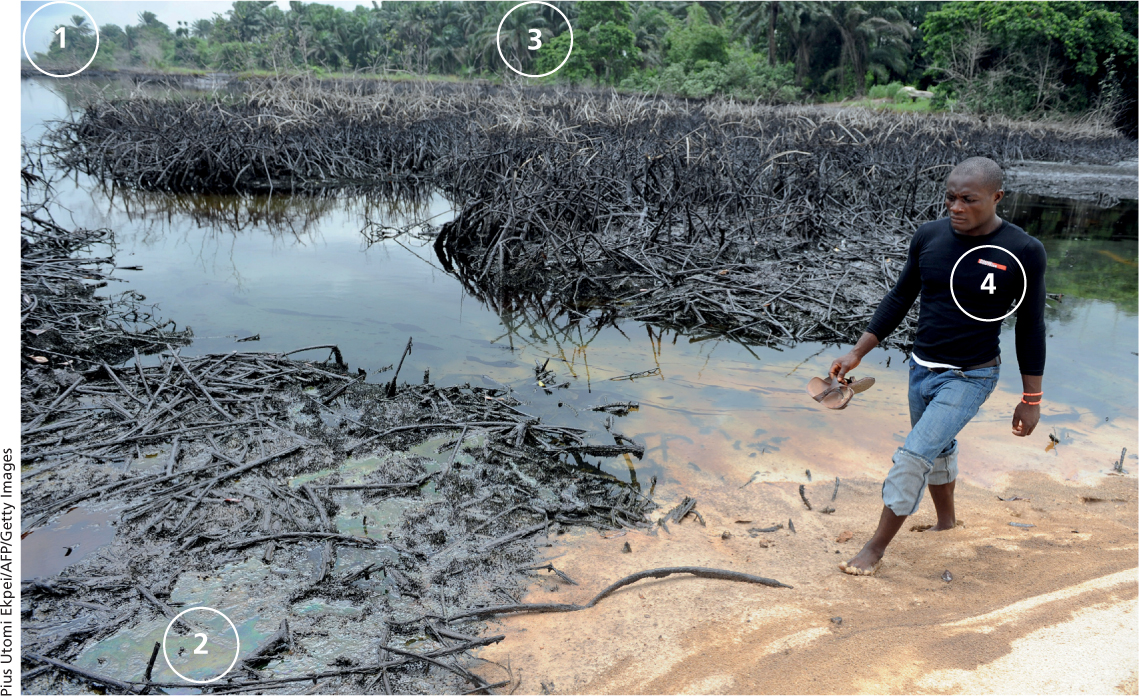
Most geographers use photographs to help them understand or explain a geographic issue or depict the character of a place. Interpreting a photo to extract its geographical information can sometimes be like detective work. Below are some points to keep in mind as you look at the pictures throughout this book. Try them out first with the photo in Figure 1.4.
(A) Landforms: Notice the lay of the land and the landform features. Is there any indication of how the landforms and humans have influenced each other? Is environmental stress visible?
(B) Vegetation: Notice whether the vegetation indicates a wet or dry, or warm or cold environment. Can you recognize specific species? Does the vegetation appear to be natural or influenced by human use?
(C) Material culture: Are there buildings, tools, clothing, foods, plantings, or vehicles that give clues about the cultural background, wealth, values, or aesthetics of the people who live where the picture was taken?
(D) What do the people in the photo suggest about the situation pictured?
(E) Can you see evidence of the global economy, such as goods that probably were not produced locally?
(F) Location: From your observations, can you tell where the picture was taken or narrow down the possible locations?
You can use this system to analyze any of the photos in this book and anywhere else. Practice by analyzing the photos in this book before you read their captions. Here is an example of how you could do this with Figure 1.4:
(A) Landforms:
The flat horizon suggests a plain or a river delta.
Environmental stress is visible in several places.
This oily liquid doesn’t look natural. Could it be crude oil?
What would have caused the landscape transformation? Maybe an oil spill?
(B) Vegetation:
This looks like fairly rich vegetation. These could be palm trees or other types of plant life found in tropical climates.
Must be fairly wet and warm, possibly tropical.
(C) Material culture:
There is not much that is obviously material culture here, just a single person. The whole area might be abandoned.
(D) People:
The clothing on this person doesn’t look like he made it. It looks mass produced.
This suggests that he has access to goods produced some distance away, maybe in a nearby city. Or he could buy things in a market where imported goods are sold.
(E) Global economy: See (D).
(F) Location: This could be somewhere tropical where there could have been an oil spill. Hint: Use this book! Look at Figure 6.19 to see the member countries of OPEC (the Organization of the Petroleum Exporting Countries). The combination of the possible oil spill and the vegetation suggests that the photo could be of Venezuela, Ecuador, Nigeria, Angola, or Indonesia. Suggestion: Read chapters 3, 7, and 10!
9
1.1.5 THE REGION AS A CONCEPT
Regions
The concept of region is useful to geographers because it allows them to break up the world into manageable units in order to analyze and compare spatial relationships. Nonetheless, regions do not have rigid definitions and their boundaries are fluid.
A region is a unit of the Earth’s surface that contains distinct patterns of physical features and/or distinct patterns of human development. It could be a desert region, a region that produces rice, or a region experiencing ethnic violence. Geographers rarely use the same set of attributes to describe any two regions. For example, the region of the southern United States might be defined by its distinctive vegetation, architecture, music, foods, and historical experience. Meanwhile Siberia, in eastern Russia, could be defined primarily by its climate, vegetation, remoteness, and sparse settlement.
region a unit of the Earth’s surface that contains distinct patterns of physical features and/or distinct patterns of human development
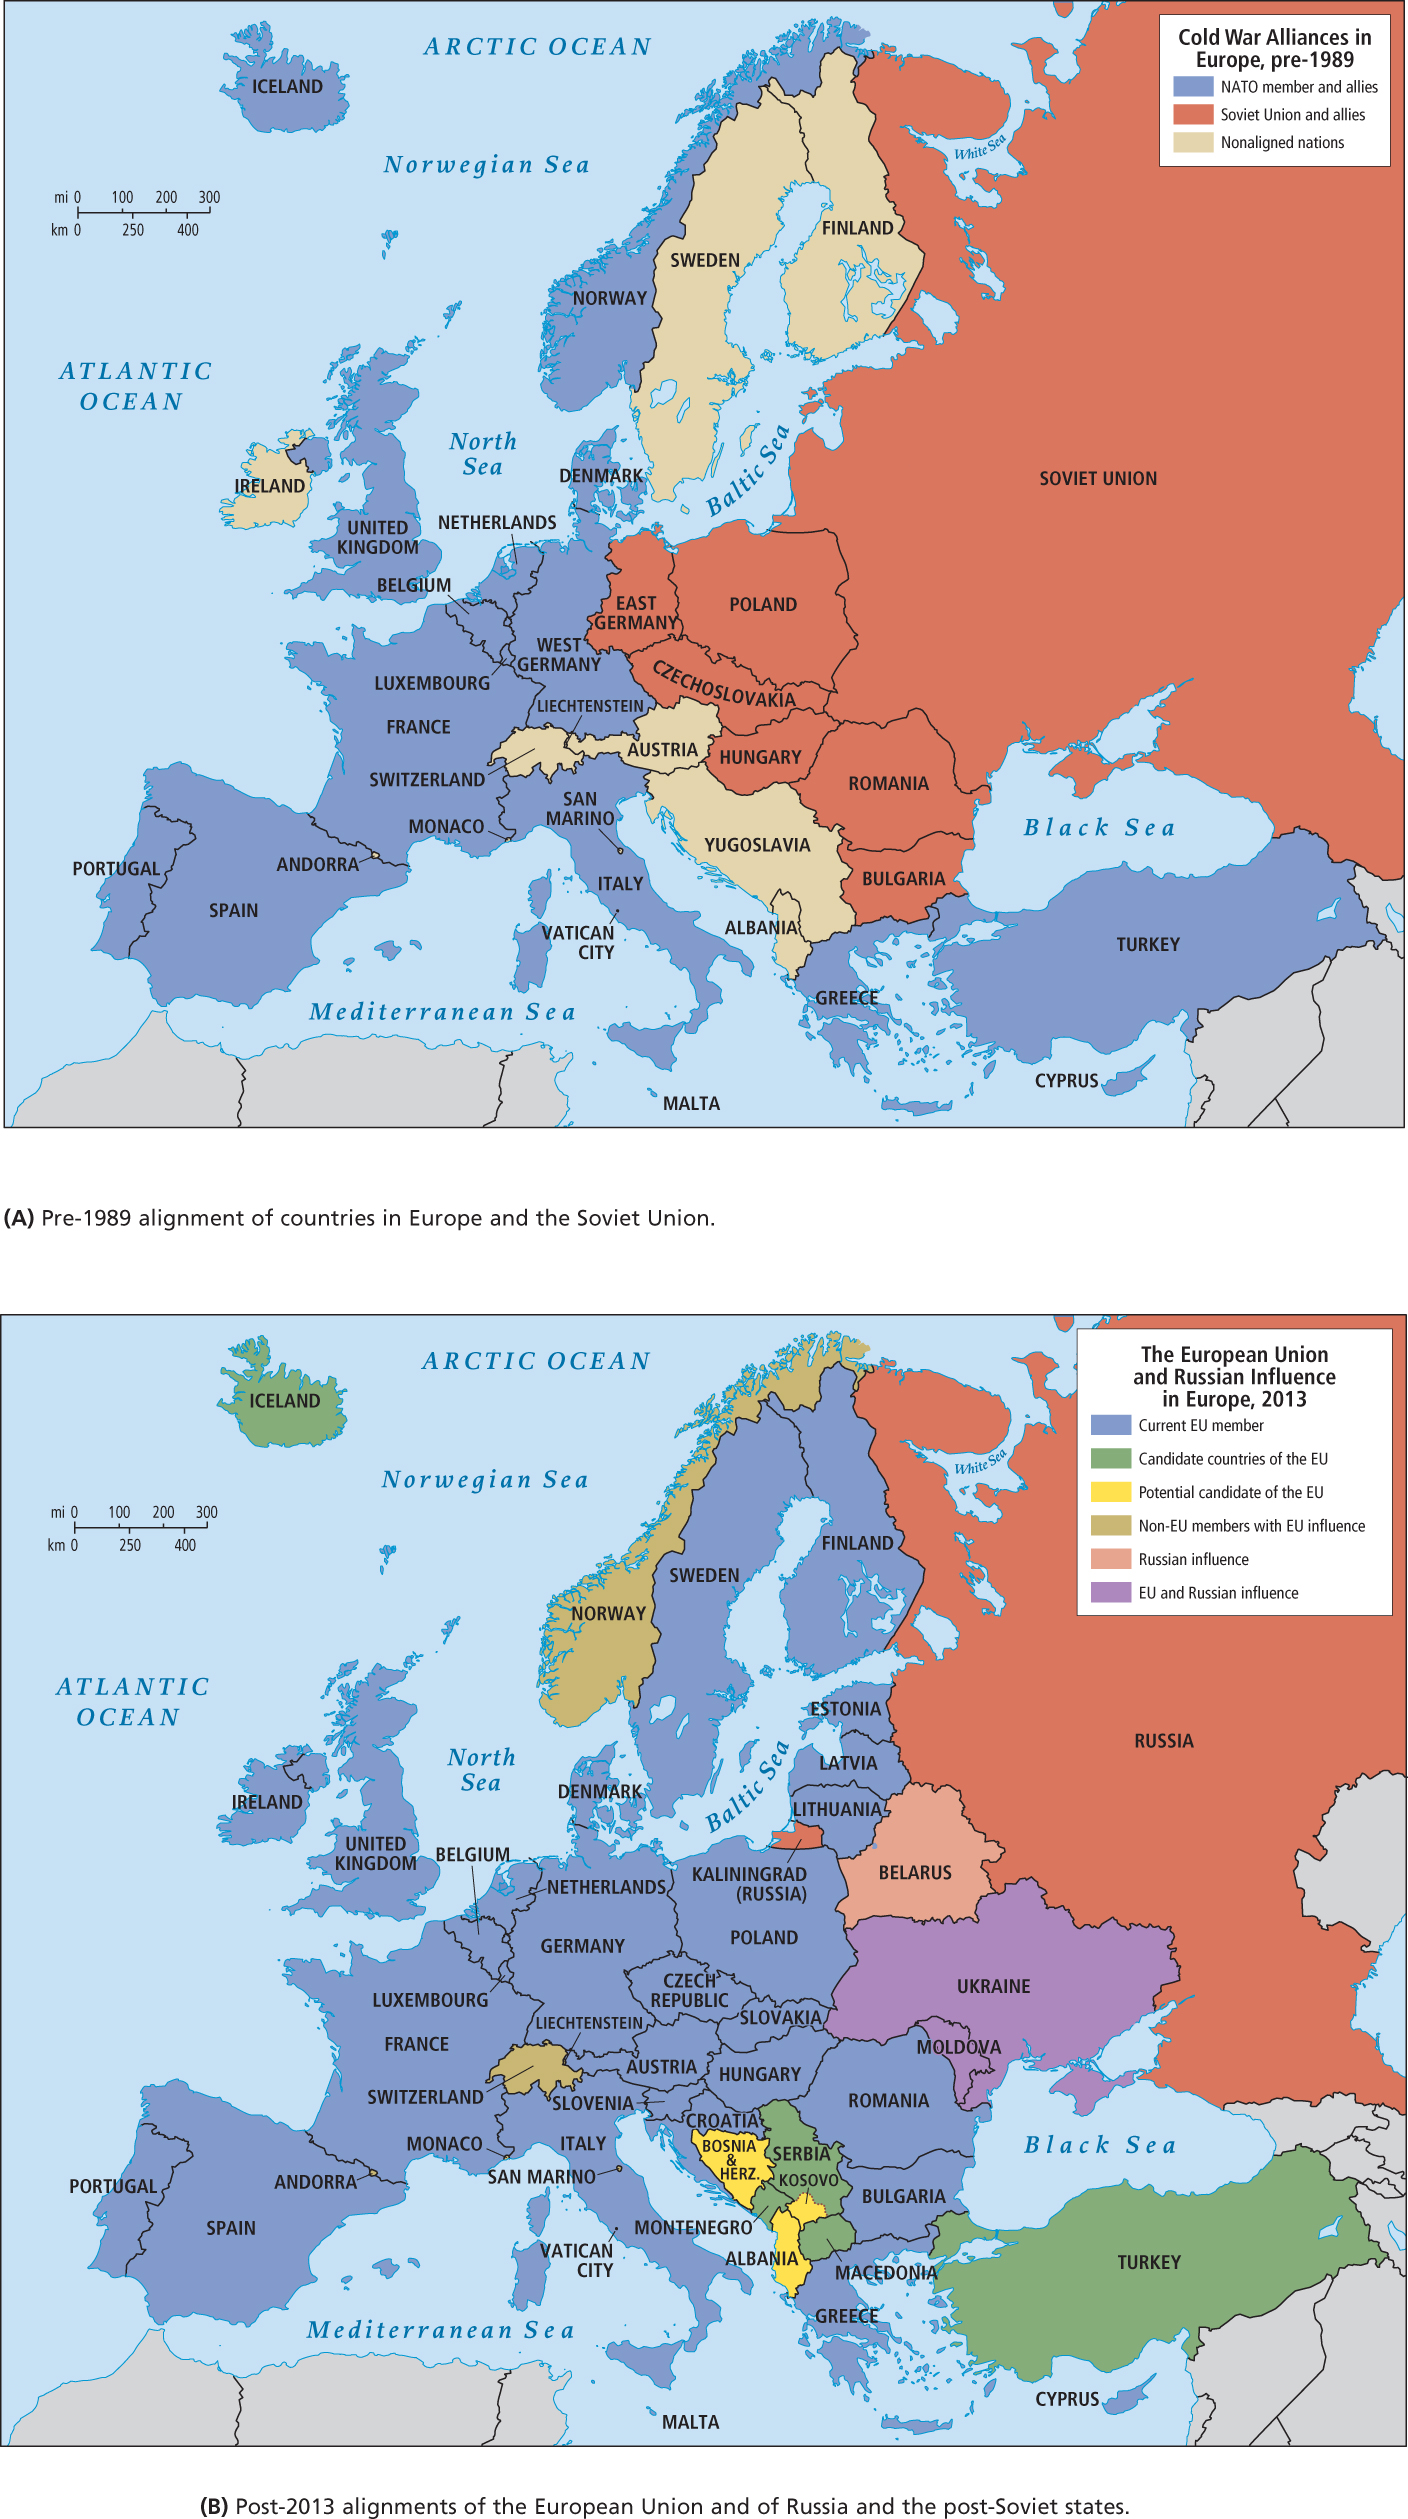
Another issue in defining regions is that they may shift over time. The people and the land they occupy may change so drastically in character that they can no longer be thought of as belonging to a certain region, and become more closely aligned with another, perhaps adjacent, region. Examples of this are countries in Central Europe, such as Poland and Hungary, which, for more than 40 years, were closely aligned with Russia and the Soviet Union, a vast region that stretched across northern Eurasia to the Pacific (Figure 1.5A). Poland and Hungary’s borders with western Europe were highly militarized and shut to travelers. In 2004, following the demise of the Soviet Union in the early 1990s and the drastic political and economic changes that then came about, Poland and Hungary became members of the European Union (EU; see Figure 1.5B). Their western borders are now open, while their eastern borders are now more heavily guarded in order to keep unwelcome immigrants and other influences out of the European Union. But through all this change—
10
A recurring problem in world regional textbooks is the changing nature of regional boundaries and the fact that on the ground they are not clear lines but linear zones of fuzziness. For example, when we first designed this textbook in the mid-
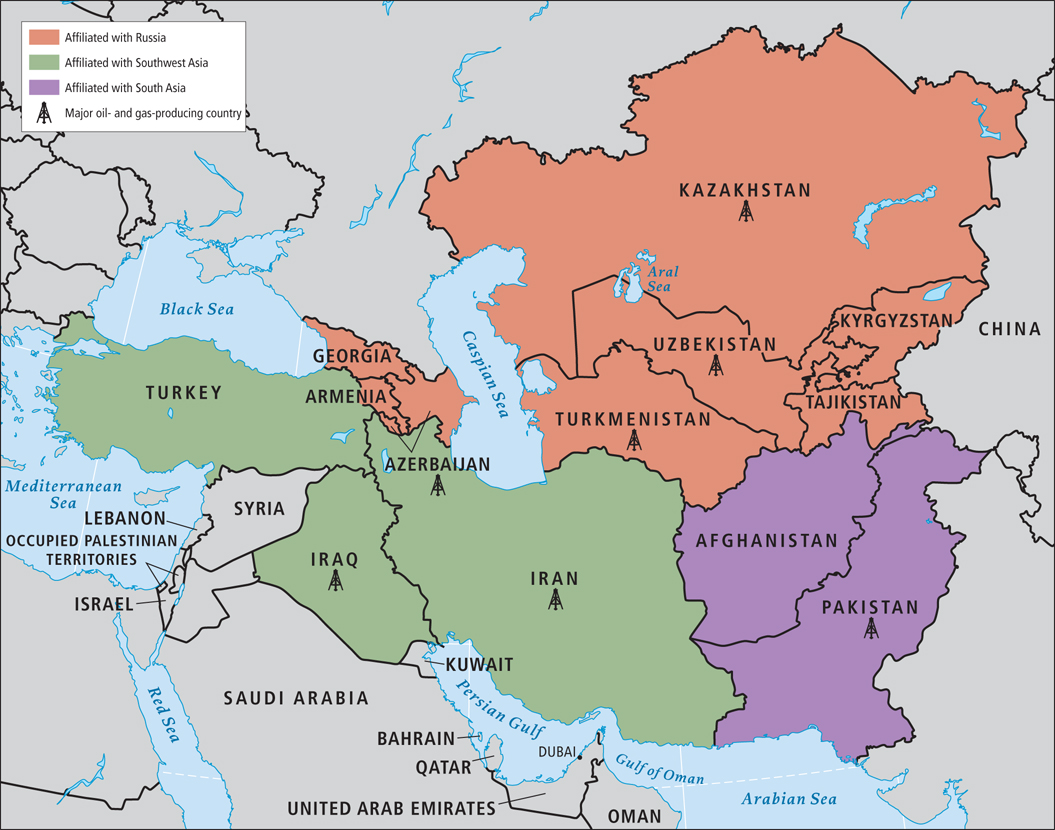
In fact, grouping these countries together in a single region would misrepresent the current situation as well as the past. A world region known as Central Asia may emerge eventually (and there are groups of interested parties discussing that possibility right now), but such a region will be slow to take shape and will be based on criteria very different from common religion, historical experiences, and environmental features. First of all, these supposed uniting features are, on closer inspection, quite diverse. There are many different versions of Islam practiced from the Mediterranean to western China and from southern Russia to the Hindu Kush. Also, to the extent that there are common historical experiences, they are actually linked more to European and Russian colonial exploitation than to an ancient and deeply uniting Central Asian cultural heritage. Finally, while environments generally defined by water scarcity are common to all the countries listed, oil and gas resources are not uniformly distributed at all. It could be that a Central Asian identity will eventually develop, perhaps centered on the leadership of Turkey or Dubai, which is trying hard to define itself as the affluent capital of such a region; but thus far, the region has not coalesced. Therefore, in this book, the countries listed above are to be found in the three different regions shown in Figure 1.6.
11
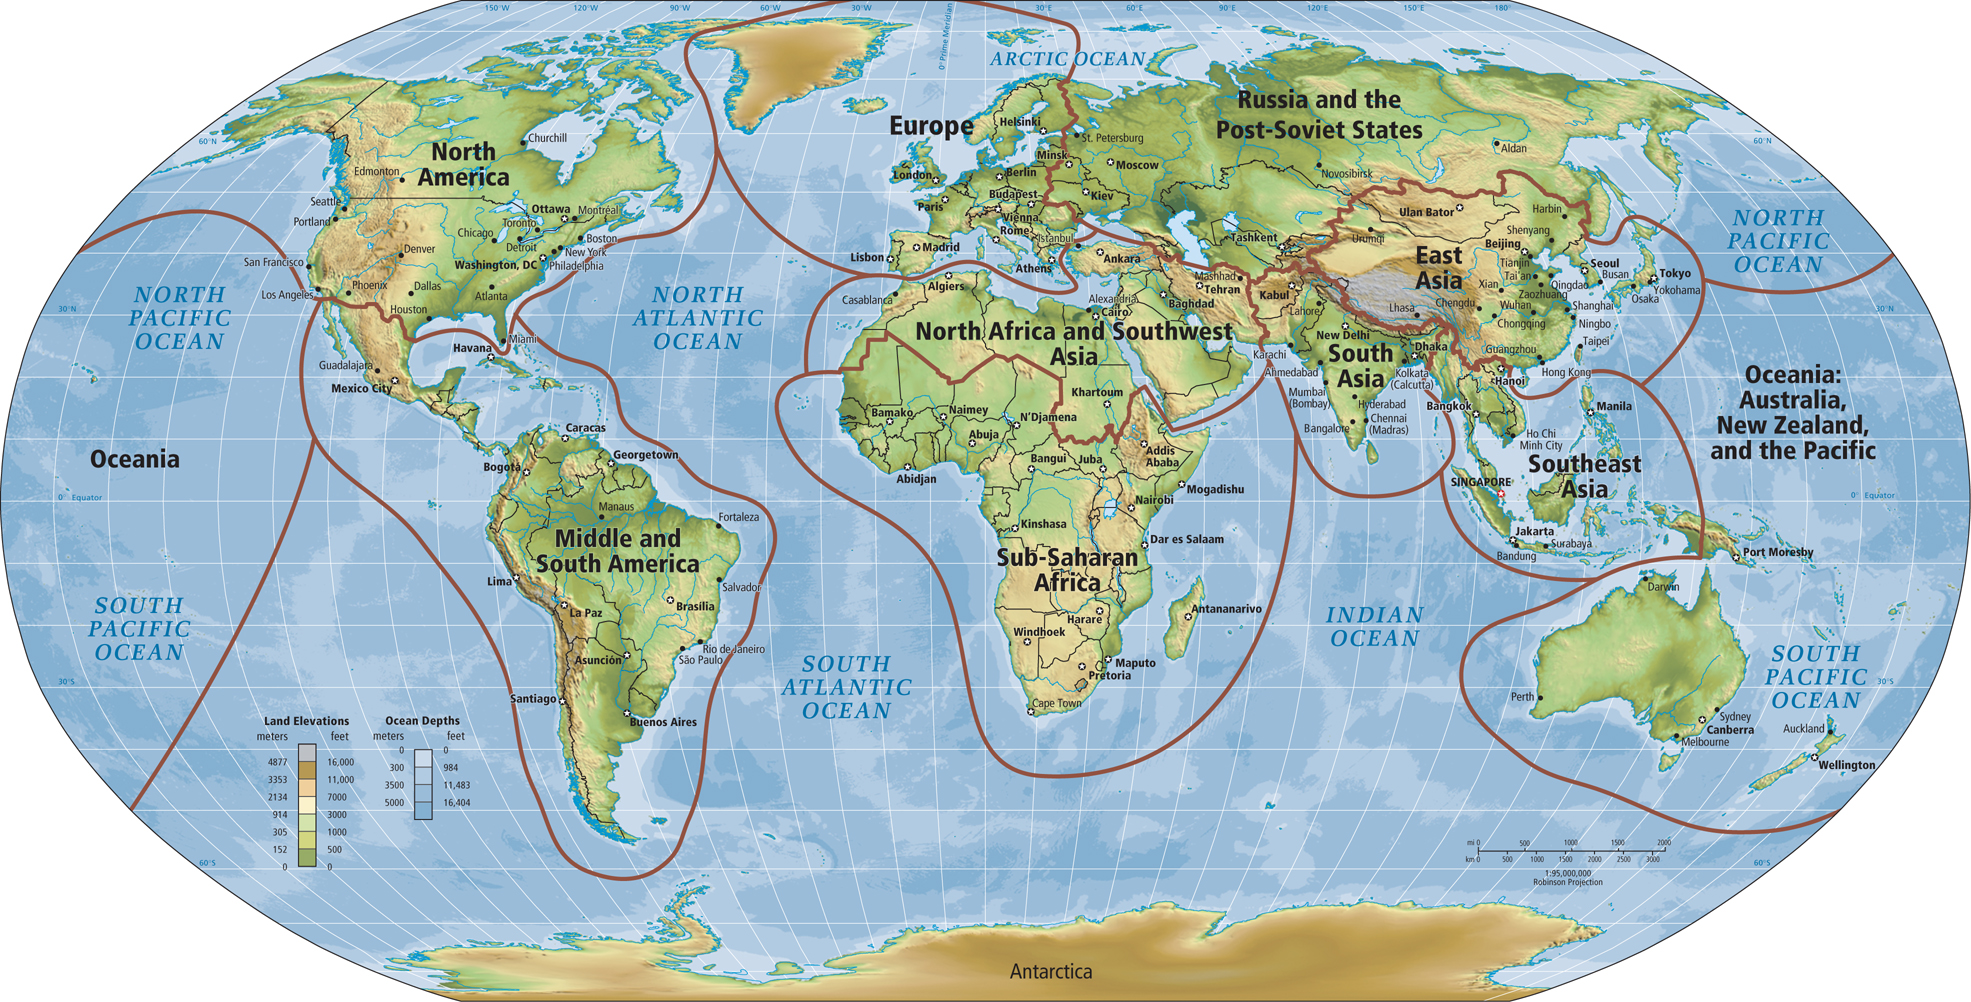
If regions are so difficult to define and describe, why do geographers use them? To discuss the whole world at once would be impossible, so geographers try to find a reasonable way to divide the world into manageable parts. There is nothing sacred about the criteria or the boundaries for the world regions we use. They are just practical aids to learning. In defining each of the world regions for this book, we have considered such factors as physical features, political boundaries, cultural characteristics, history, how the places now define themselves, and what the future may hold. We are constantly reevaluating regional boundaries and, in this edition, have made some changes. For example, the troubled new country of South Sudan, once part of North Africa and Southwest Asia, is now considered part of sub-
This book organizes the material into three regional scales of analysis: the global scale, the world regional scale, and the local scale. The term scale of analysis refers to the relative size of the area under discussion. At the global scale, explored in this chapter, the entire world is treated as a single area—
global scale the level of geography that encompasses the entire world as a single unified area
local scale the level of geography that describes the space where an individual lives or works; a city, town, or rural area
12
In summary, regions have the following traits:
A region is a unit of the Earth’s surface that contains distinct environmental or cultural patterns.
No two regions are necessarily defined by the same set of attributes.
Regional definitions and the territory included often change.
The boundaries of regions are usually indistinct and hard to agree upon.
Regions can vary greatly in size (scale).
1.1.6 THEMATIC CONCEPTS AND GEOGRAPHIC INSIGHTS IN THIS BOOK
Within the world regional framework, this book is also organized around five thematic concepts of special significance in the modern world. These concepts are the focus of the Geographic Insights of every chapter in this book: the environment, globalization and development, power and politics, urbanization, and population and gender. The sections that follow explain each of these five thematic concepts, how they tie in with the main concerns of geographers, and how they are related to each other.
THINGS TO REMEMBER
Physical geographers study the Earth’s surface and the processes that shape it. There is a continual interaction between physical and human processes.
Among geographers’ most important tools are maps, which they use to record, analyze, and explain spatial relationships.
The careful analysis of photographs can lead to important understandings about places and geographic issues.
A region is a unit of the Earth’s surface that has a combination of distinct physical and/or human features; the complex of features can vary from region to region, and regional boundaries are rarely clear or precise.