1.10 POPULATION
GEOGRAPHIC INSIGHT 5
Population and Gender: Population growth is slowing for a number of reasons, among them the increasing numbers of women who are delaying childbearing as they pursue educational and work opportunities outside the home.
Over the last several hundred years, the human population has boomed, but growth rates are now slowing in most societies and, in a few, have even begun to decline (a process called negative growth). Much of this pattern has to do with changes in economic development, urbanization, and gender roles that have reduced incentives for large families.
1.10.1 GLOBAL PATTERNS OF POPULATION GROWTH
It took between 1 million and 2 million years (at least 40,000 generations) for humans to evolve and to reach a population of 2 billion, which happened around 1945. Then, remarkably, in just 66 years—
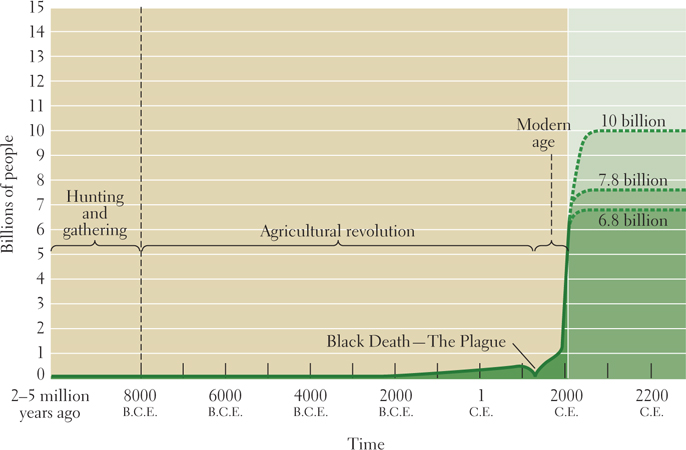
The explanation lies in changing relationships between humans and the environment. For most of human history, fluctuating food availability, natural hazards, and disease kept human death rates high, especially for infants. Out of many pregnancies, a couple might raise only one or two children. Also, pandemics such as the Black Death in Europe and Asia in the 1300s killed millions of people in a short time.
An astonishing upsurge in human population began about 1500, at a time when the technological, industrial, and scientific revolutions were beginning in some parts of the world. Human life expectancy increased dramatically, and more and more people lived long enough to reproduce successfully, often many times over. The result was an exponential pattern of growth (see Figure 1.25). This pattern is often called a J curve because the ever-
44
Today, the human population is growing in most regions of the world, more rapidly in some places than in others. The reason for this growth is that currently a very large group of young people has reached the age of reproduction and more will join them shortly. Nevertheless, the rate of global population growth is slowing. Since 1993 it has dropped from 1.7 percent per year to roughly 1.1 percent per year, which is where it stands today. If present slower growth trends continue, the world population may level off at between 7.8 billion and 10 billion before 2050. However, this projection is contingent on couples in less-
In a few countries (especially Japan in Asia; Ukraine plus Romania, Bulgaria, and Hungary in Central Europe), the population is actually declining and rapidly aging, due primarily to low birth and death rates. This situation could prove problematic, as those who are elderly and dependent become more numerous, posing a financial burden on a declining number of working- 11. WORLD POPULATION TO BE CONCENTRATED IN DEVELOPING NATIONS, AS TOTAL EXPECTED TO REACH 9 BILLION BY 2050
Local Variations in Population Density and Growth
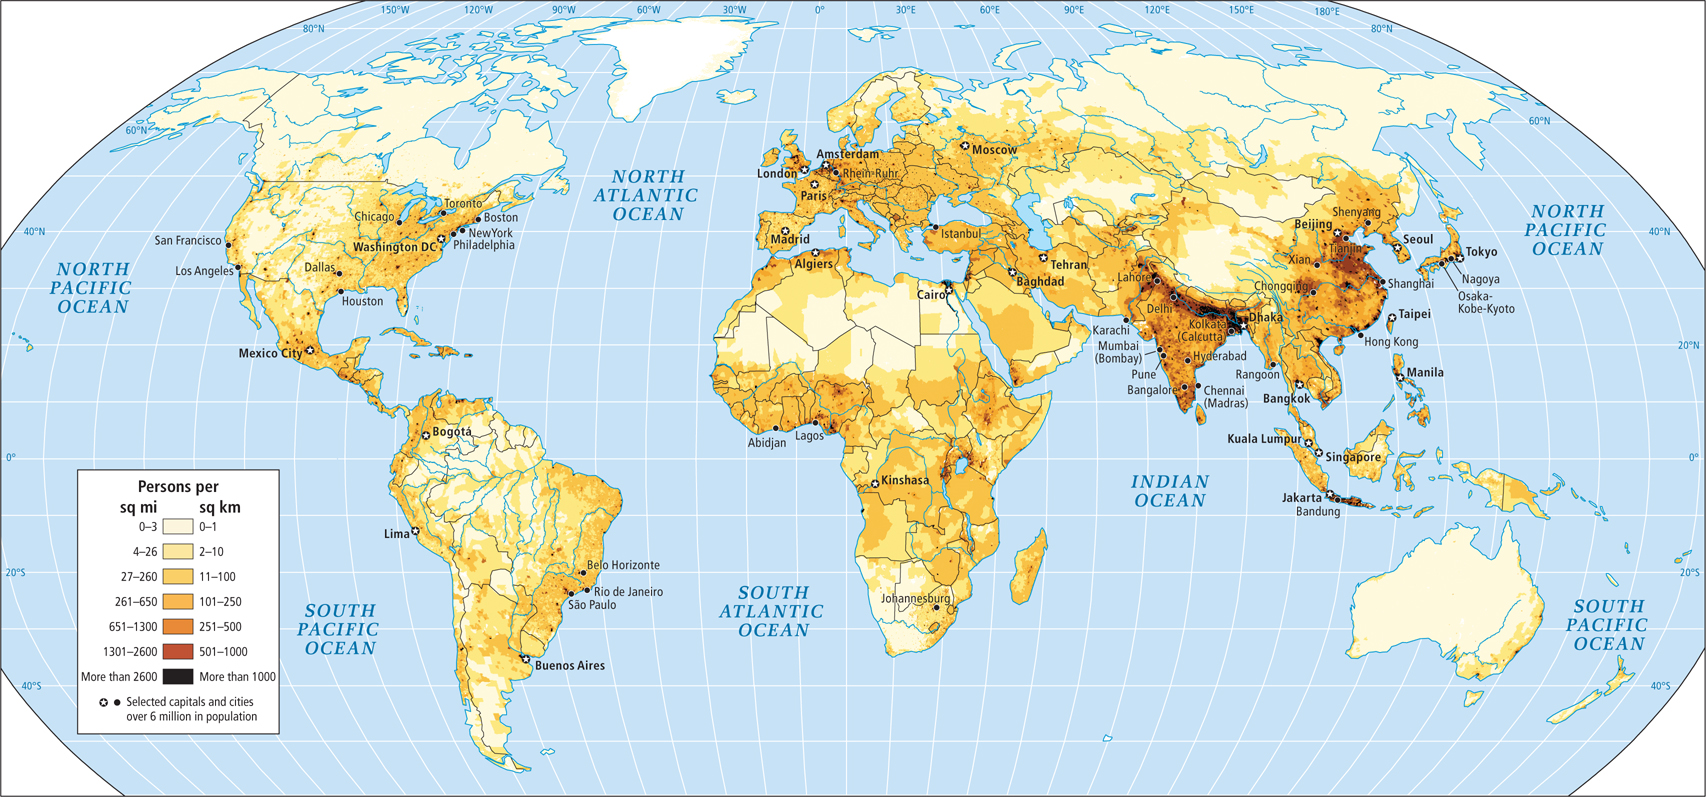
If the more than 7 billion people on Earth today were evenly distributed across the land surface, they would produce an average population density of about 121 people per square mile (47 per square kilometer). But people are not evenly distributed (Figure 1.26). Nearly 90 percent of all people live north of the equator, and most of them live between 20° N and 60° N latitude. Even within that limited territory, people are concentrated on about 20 percent of the available land. They live mainly in zones that have climates warm and wet enough to support agriculture: along rivers, in lowland regions, or fairly close to the sea. In general, people are located where resources are available.
Usually, the variable that is most important for understanding population growth in a region is the rate of natural increase (often called the growth rate). The rate of natural increase (RNI) is the relationship in a given population between the number of people being born (the birth rate) and the number dying (the death rate), without regard to the effects of migration (the movement of people from one place or country to another).
rate of natural increase (RNI) the rate of population growth measured as the excess of births over deaths per 1000 individuals per year without regard for the effects of migration
birth rate the number of births per 1000 people in a given population, per unit of time (usually per year)
death rate the ratio of total deaths to total population in a specified community, usually expressed in numbers per 1000 or in percentages
migration the movement of people from one place or country to another, often for safety or economic reasons
45
46
The rate of natural increase is expressed as a percentage per year. For example, in 2011, the annual birth rate in Austria (in Europe) was 9 per 1000 people, and the death rate was 9 per 1000 people. Therefore, the annual rate of natural increase was 0 per 1000 (9 − 9 = 0), or 0 percent.
For comparison, consider Jordan (in Southwest Asia). In 2011, Jordan’s birth rate was 31 per 1000, and the death rate was 4 per 1000. Thus the annual rate of natural increase was 27 per 1000 (31 − 4 = 27), or 2.7 percent per year. At this rate, Jordan’s population will double in just 29 years.
Total fertility rate (TFR), another term used to indicate trends in population, is the average number of children a woman in a particular population is likely to have during her reproductive years (15–
total fertility rate (TFR) the average number of children that women in a particular population are likely to have at the present rate of natural increase
47
Another powerful contributor to population growth is immigration (in-
immigration in-
emigration out-
1.10.2 AGE AND SEX STRUCTURES
The age and sex structures of a country’s population reflect past and present social conditions and can help predict future population trends. The age distribution, or age structure, of a population is the proportion of the total population in each age group. The sex structure is the proportion of males and females in each age group.
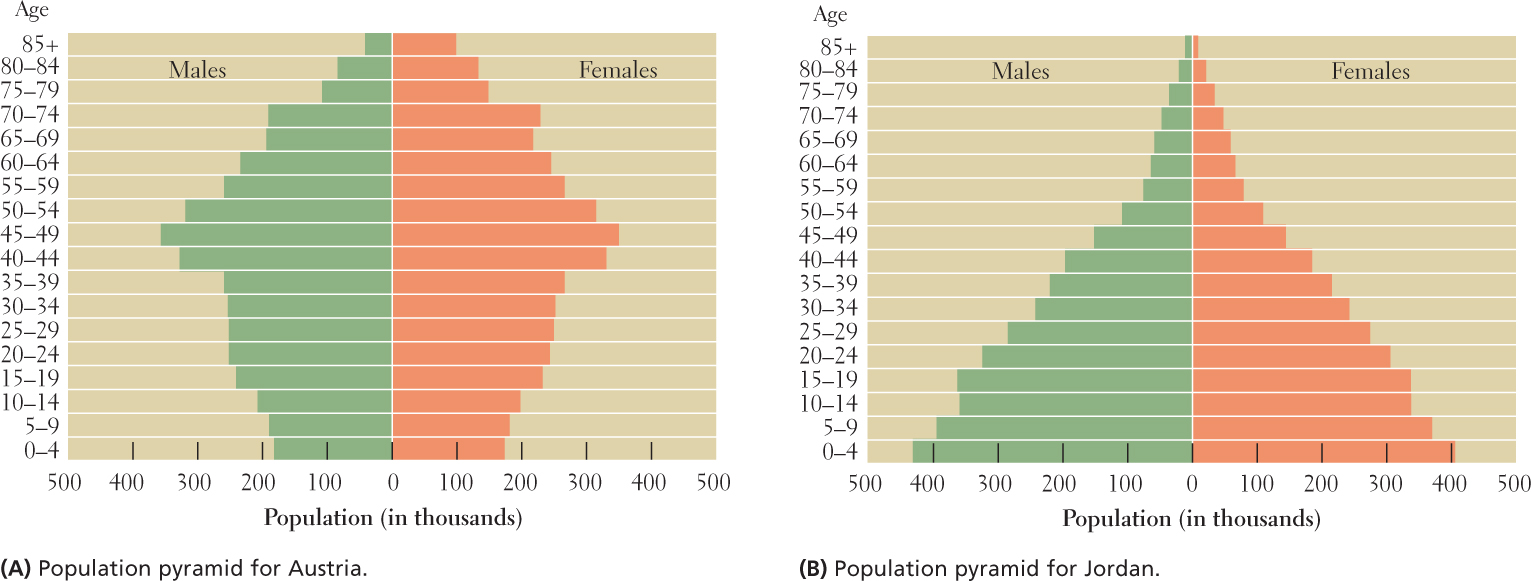
The population pyramid is a graph that depicts age and sex structures. Consider the population pyramids for Austria and Jordan (Figure 1.27). Notice that Jordan’s is a true pyramid, with a wide bottom, and that the largest groups are in the age categories 0 through 19.
population pyramid a graph that depicts the age and sex structures of a political unit, usually a country
By contrast, Austria’s pyramid has an irregular vertical shape that tapers in toward the bottom. The base, which began to narrow about 40 years ago, indicates that there are now fewer people in the youngest age categories than in the teen, young adulthood, or middle-
Population pyramids also reveal sex imbalance within populations. Look closely at the right (female) and left (male) halves of the pyramids in Figure 1.27. In several age categories, the sexes are not evenly balanced on both sides of the line. In the Austria pyramid, there are more women than men near the top (especially in the age categories of 70 and older). In Jordan, there are more males than females near the bottom (especially for ages 0 to 24).
Demographic research on the reasons behind statistical sex imbalance is relatively new, and many different explanations are proposed. In Austria, the predominance of elderly women reflects the fact that women live about 5 years longer than men in countries with long life expectancies (a trend that is still poorly understood). But the sex imbalance in younger populations has different explanations. The normal ratio worldwide is for about 95 females to be born for every 100 males. Because baby boys are somewhat weaker than girls on average, the ratio normally evens out naturally within the first 5 years. However, in many places the ratio is as low as 80 females to 100 males and continues throughout the life cycle. The widespread cultural preference for boys over girls (discussed in later chapters) becomes more observable as couples choose to have fewer children. Some fetuses, if identified as female, are purposely aborted; also, girls and women are sometimes fed less well and receive less health care than males, especially in poverty-
1.10.3 POPULATION GROWTH RATES AND WEALTH
Although there is a wide range of variation, regions with slow population growth rates usually tend to be affluent, and regions with fast growth rates tend to have widespread poverty. The reasons for this difference are complicated; again, Austria and Jordan are useful examples.
48
In 2013, Austria had an annual gross national income (GNI) per capita of $43,220 (PPP). This figure represents the total production of goods and services in a country in a given year, divided by the mid-
gross national income (GNI) per capita the total production of goods and services in a country in a given year, divided by the mid-
By contrast, Jordan has a GNI (PPP) per capita of $5730, in addition to a high infant mortality rate of 23 per 1000. Much everyday work is still done by hand, so each new child is a potential contributor to the family income at a young age. There is little social welfare for elderly citizens and a much greater risk of children not surviving into adulthood. Having more children helps ensure that someone will be there to provide care for aging parents and grandparents.
However, circumstances in Jordan have changed rapidly over the last 25 years. In 1985, Jordan’s per capita GDP was $993, infant mortality was 77 per 1000, and women had an average of 8 children. Now Jordanian women have an average of only 3.8 children, with the need to educate those children increasingly recognized. Geographers would say that Jordan is going through a demographic transition, meaning that a period of high birth and death rates is giving way to a period of much lower birth and death rates (Figure 1.28). In the middle phases, however, when death rates decline more rapidly than birth rates (Jordan’s death rate is just 4 per 1000 but its birth rate is 31 per 1000), population numbers can increase rapidly as attitudes about optimal family size slowly adjust. Populations may eventually stabilize, but because of the lag in the lowering of birth rates, population numbers may be significantly higher than they were at the beginning of the transition.
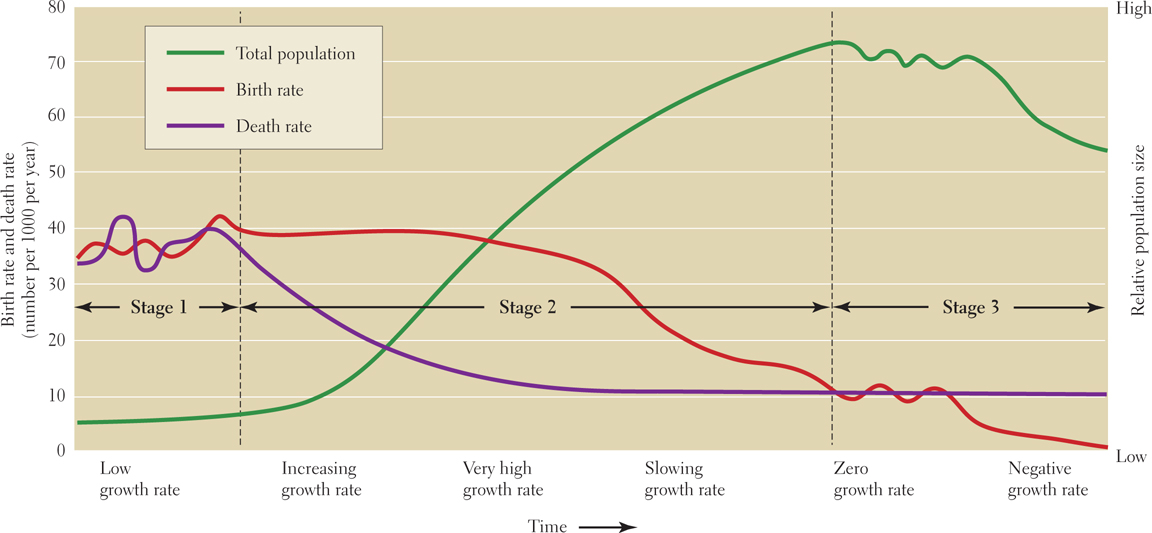
demographic transition the change from high birth and death rates to low birth and death rates that usually accompanies a cluster of other changes, such as change from a subsistence to a cash economy, increased education rates, and urbanization
The demographic transition begins with the shift from subsistence to cash economies and from rural to urban ways of life. In a subsistence economy, a family, usually in a rural setting, produces most of its own food, clothing, and shelter, so there is little need for cash. Many children are needed to help perform the work that supports the family and birth rates are high. Most needed skills are learned around the home, farm, and surrounding lands, so expensive educations at technical schools and universities are not needed. Today, subsistence economies are disappearing as people seek cash with which to buy food and goods such as television sets and bicycles. In a cash economy, which tends to be urban but may be rural, skilled workers, well-
subsistence economy an economy in which families produce most of their own food, clothing, and shelter
cash economy an economic system that tends to be urban but may be rural, in which skilled workers, well-
49
1.10.4 GENDER
Note the difference between the terms gender and sex. Gender indicates how a particular social group defines the differences between the sexes. Sex refers to the biological category of male or female but does not indicate how males or females may behave or identify themselves. Gender definitions and accepted behavior for the sexes can vary greatly from one social group to another. Here we consider gender.
gender the ways a particular social group defines the differences between the sexes
sex the biological category of male or female; does not indicate how males or females may behave or identify themselves
For women, the historical and modern global gender picture is puzzlingly negative. In nearly every culture, in every region of the world, and for a great deal of recorded history, women have had (and still have) an inferior status. Exceptions are rare, although the intensity of this second-
In nearly all cultures, families prefer boys over girls because, as adults, boys will have greater earning capacity (Table 1.2) and more power in society. This preference for boys has some unexpected side effects. For example, the preference may lead to fewer girls being born; eventually there will be a shortage of marriageable women, leaving many men without the hope of forming a family. Currently, there is concern in several Asian societies that the scarcity of young women could lead to antisocial behavior on the part of discouraged young men.
6. WOMEN STILL LAG BEHIND MEN IN TOP BOARDROOM JOBS
|
Country |
HDI rank |
Female income |
Male income |
Female income |
|---|---|---|---|---|
|
Austria |
19 |
22,528 |
55,934 |
40 |
|
Barbados |
47 |
15,119 |
23,507 |
64 |
|
Botswana |
118 |
8823 |
17,952 |
49 |
|
Canada |
6 |
30,005 |
45,763 |
66 |
|
Japan |
12 |
20,572 |
44,892 |
46 |
|
Jordan |
95 |
2456 |
8581 |
29 |
|
Kuwait |
63 |
24,531 |
65,010 |
38 |
|
Poland |
39 |
13,886 |
24,292 |
57 |
|
Russia |
66 |
15,191 |
23,284 |
65 |
|
Saudi Arabia |
56 |
7157 |
36,727 |
19 |
|
Sweden |
10 |
32,990 |
41,830 |
79 |
|
United Kingdom |
28 |
28,354 |
42,217 |
67 |
|
United States |
4 |
35,346 |
56,918 |
62 |
Sources: Income data from “Estimated earned income,” The Global Gender Gap Report 2011 (Geneva: World Economic Forum), 44, table D3, http:/
HDI data from United Nations Human Development Report 2011, 128, table 1, http:/
Gender Roles
Geographers have begun to pay more attention to gender roles—the socially assigned roles for males and females—
gender roles the socially assigned roles for males and females
There are some striking consistencies regarding traditional gender roles over time and around the globe. Men are expected to fulfill public roles, while women fulfill private roles. Certainly there are exceptions in every culture, and customs are changing, especially in wealthier countries. But generally, men work outside the home in positions such as executives, animal herders, hunters, farmers, warriors, or government leaders. Women keep house, bear and rear children, care for the elderly, grow and preserve food, and prepare the meals, among many other tasks. In nearly all cultures, women are defined as dependent on men—
50
Gender Issues
Because their activities are focused on the home, women tend to marry early. One quarter of the girls in developing countries are mothers before they are 18. This is crucial in that pregnancy is the leading cause of death among girls aged 15 to 19 worldwide, primarily because immature female bodies are not ready for the stress of pregnancy and birth. Globally, babies born to women under 18 have a 60 percent higher chance of dying in infancy than do those born to women over 18.
Typically, women also have less access to education than men (around the world, 70 percent of youth who leave school early are girls). They are less likely to have access to information and paid employment, and so have less access to wealth and political power. When they do work outside the home (as is the case increasingly in every world region), women tend to fill lower-
Gender and sex categories can be confusing in matters such as the extent to which physical differences between males and females may affect their social roles. On average, males are stronger and taller, but females have comparable endurance and pain tolerance. Women’s physical capabilities are somewhat limited during pregnancy and nursing but from the age of about 45, women are no longer subject to the limits of pregnancy, and most contribute in some significant way to the well-

THINKING GEOGRAPHICALLY
Question 1.16
RIwJdegs5ylUyMRrNPyyeJtWB18Y018O3Eg5DAIv6SKQrOJv2mh6YEhvdNmw/USXbs1p3c7By3Bzn27PINiWDKHDEMKP8Oq+sLMVqqgyYvFndSkHjPHiNkAOnwALfbn3aNfu3DPX073UP5ReVut7BtdVGe4=Perhaps more than for any other culturally defined human characteristic, significant agreement exists that gender is important, but just how gender roles are defined varies greatly across places and over time.
Traditional notions of gender roles are now being challenged everywhere. In many countries, including conservative Muslim countries, females are acquiring education at higher rates than males. Although it will take females a while to catch up, eventually education should make women competitive with men for jobs and roles in public life as policy makers and government officials, not just as voters. Unless discrimination persists, women should also begin to earn pay equal to that of men (see Table 1.2).
Research data suggest that there is a ripple effect that benefits the whole group when developing countries pay attention to the needs of girls:
51
Girls in developing countries who get 7 or more years of education marry 4 years later than average and have 2.2 fewer children.
An extra year of secondary schooling over the average for her locale boosts a girl’s lifetime income by 15 to 25 percent.
The children of educated mothers are healthier and more likely to finish secondary school.
When women and girls earn income, 90 percent of their earnings are invested in the family, compared to just 40 percent of males’ earnings.
Considering only women’s perspectives on gender, however, misses half the story. Men are also affected by strict gender expectations, often negatively. For most of human history, young men have borne a disproportionate share of burdensome physical tasks and dangerous undertakings. Until recently, mostly young men left home to migrate to distant, low-
An emerging body of research suggests that sexual violence is widespread and inextricably linked to gender roles. A recent survey of 10,000 men in six Asian countries indicated that one in four participants had raped a woman, usually a romantic partner. Seventy percent of the men who had committed rape said they felt entitled to do so. This and similar studies done in other countries suggest that rape is a widespread global phenomenon deeply rooted in power relations between genders, and that preventative measures are most effective during childhood and adolescence.
This book will return repeatedly to the question of gender disparities because they play such a central role in so many global problems and in creating a more just future for all people.
THINGS TO REMEMBER
GEOGRAPHIC INSIGHT 5
Population and Gender Population growth is slowing for a number of reasons, among them the increasing numbers of women who are delaying childbearing as they pursue educational and work opportunities outside the home.
Over the last several hundred years, global population growth has been rapid. Although growth will continue for many years, rates are now slowing in most places and in a few places growth has reversed and the population is even shrinking.
The circumstances that lead to lower population growth rates also lead to the overall aging of populations; these two phenomena are found nearly everywhere in the world today, but to varying degrees.
Gender—
the sexual category of a person— is both a biological and a cultural phenomenon. Gender indicates how a particular group defines the social differences between the sexes. Sex is the biological category of male or female. There are some global consistencies in gender disparities: typically, males have public roles and females have private roles; in every country, the average woman earns less than the average man.