1.3 GLOBAL CLIMATE CHANGE
Planet Earth is continually undergoing climate change, a slow shifting of climate patterns caused by the general cooling or warming of the atmosphere. The current trend of global warming—which refers to the observed warming of the Earth’s climate as atmospheric levels of greenhouse gases increase—
climate change a slow shifting of climate patterns due to the general cooling or warming of the atmosphere
global warming the warming of the Earth’s climate as atmospheric levels of greenhouse gases increase
greenhouse gases (GHG) gases, such as carbon dioxide and methane, released into the atmosphere by human activities, which become harmful when released in excessive amounts
Most scientists now agree that there is an urgent need to reduce greenhouse gas emissions to avoid catastrophic climate change in coming years. Climatologists, biogeographers, and other scientists are documenting long-
However, a key problem is that those most responsible for global warming (the world’s wealthiest and most industrialized countries) have the least incentive to reduce emissions because they are the least vulnerable to the changes global warming causes in the physical environment. Meanwhile, those most vulnerable to these changes (poor countries with low human development and with large slums in low-
Drivers of Global Climate Change
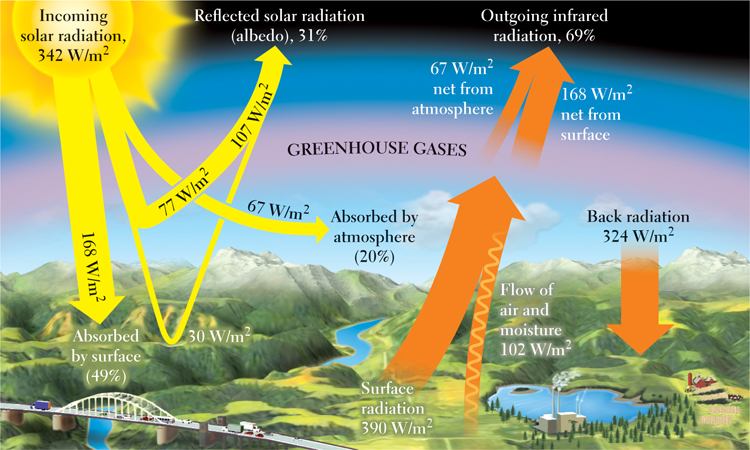
Greenhouse gases exist naturally in the atmosphere. It is their heat-
Electricity generation, vehicles, industrial processes, and the heating of homes and businesses all burn large amounts of CO2-producing fossil fuels such as coal, natural gas, and oil. Even the large-
Widespread deforestation worsens the situation. Living forests take in CO2 from the atmosphere, release the oxygen, and store the carbon in their biomass. As more trees are cut down and their wood is used for fuel, more carbon enters the atmosphere, less is taken out, and less is stored. The loss of trees and other forest organisms produces as much as 30 percent of the buildup of CO2 in the atmosphere. The use of fossil fuels accounts for the remaining 70 percent.
22
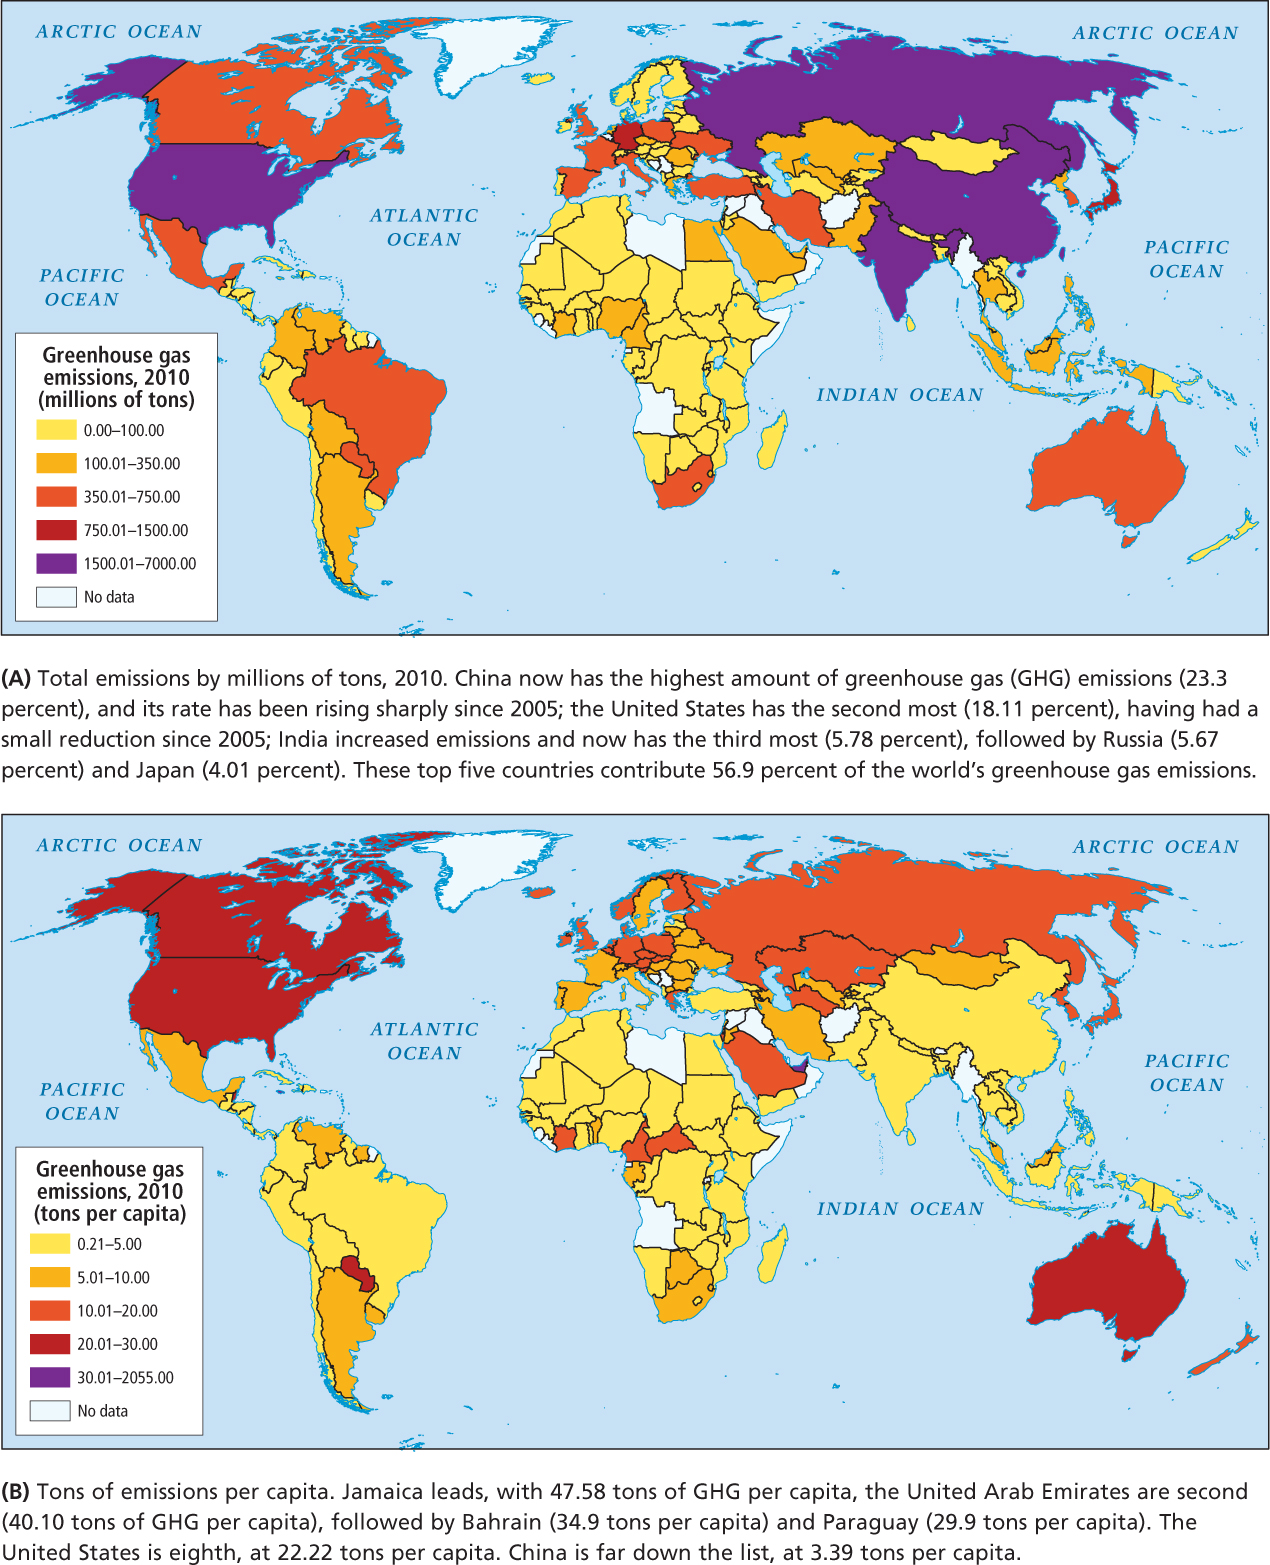
In percentages, the largest producers of total greenhouse gas emissions in 2010 were the industrialized countries and large, rapidly developing countries. The caption of Figure 1.14 lists the countries that are the most responsible for GHG emissions, total (A) and per capita (B). Note that the United States is among the leaders in both categories. For the period of 1859 to 1995, developed countries produced roughly 80 percent of the greenhouse gases from all types of industrial, home, and transportation sources, and developing countries produced 20 percent. But by 2007, the developing countries were catching up, accounting for nearly 30 percent of total emissions. As developing countries industrialize over the next century and continue to cut down their forests, they will release more and more greenhouse gases every year. If current patterns hold, greenhouse gas contributions by the developing countries will exceed those of the developed world by 2040.
23
Climate-Change Impacts
While it is not clear exactly what the impacts of rising global temperatures will be, it is clear that they will not be uniform across the globe. One prediction is that the glaciers and polar ice caps will melt, causing a corresponding rise in sea level. In fact, this phenomenon has been observable for several years. Satellite imagery analyzed by scientists at the National Aeronautics and Space Administration (NASA) shows that between 1979 and 2005—
The melting of the ice caps also has several other effects. Already, trillions of gallons of meltwater have been released into the oceans. If this trend continues, at least 60 million people in coastal areas and on low-
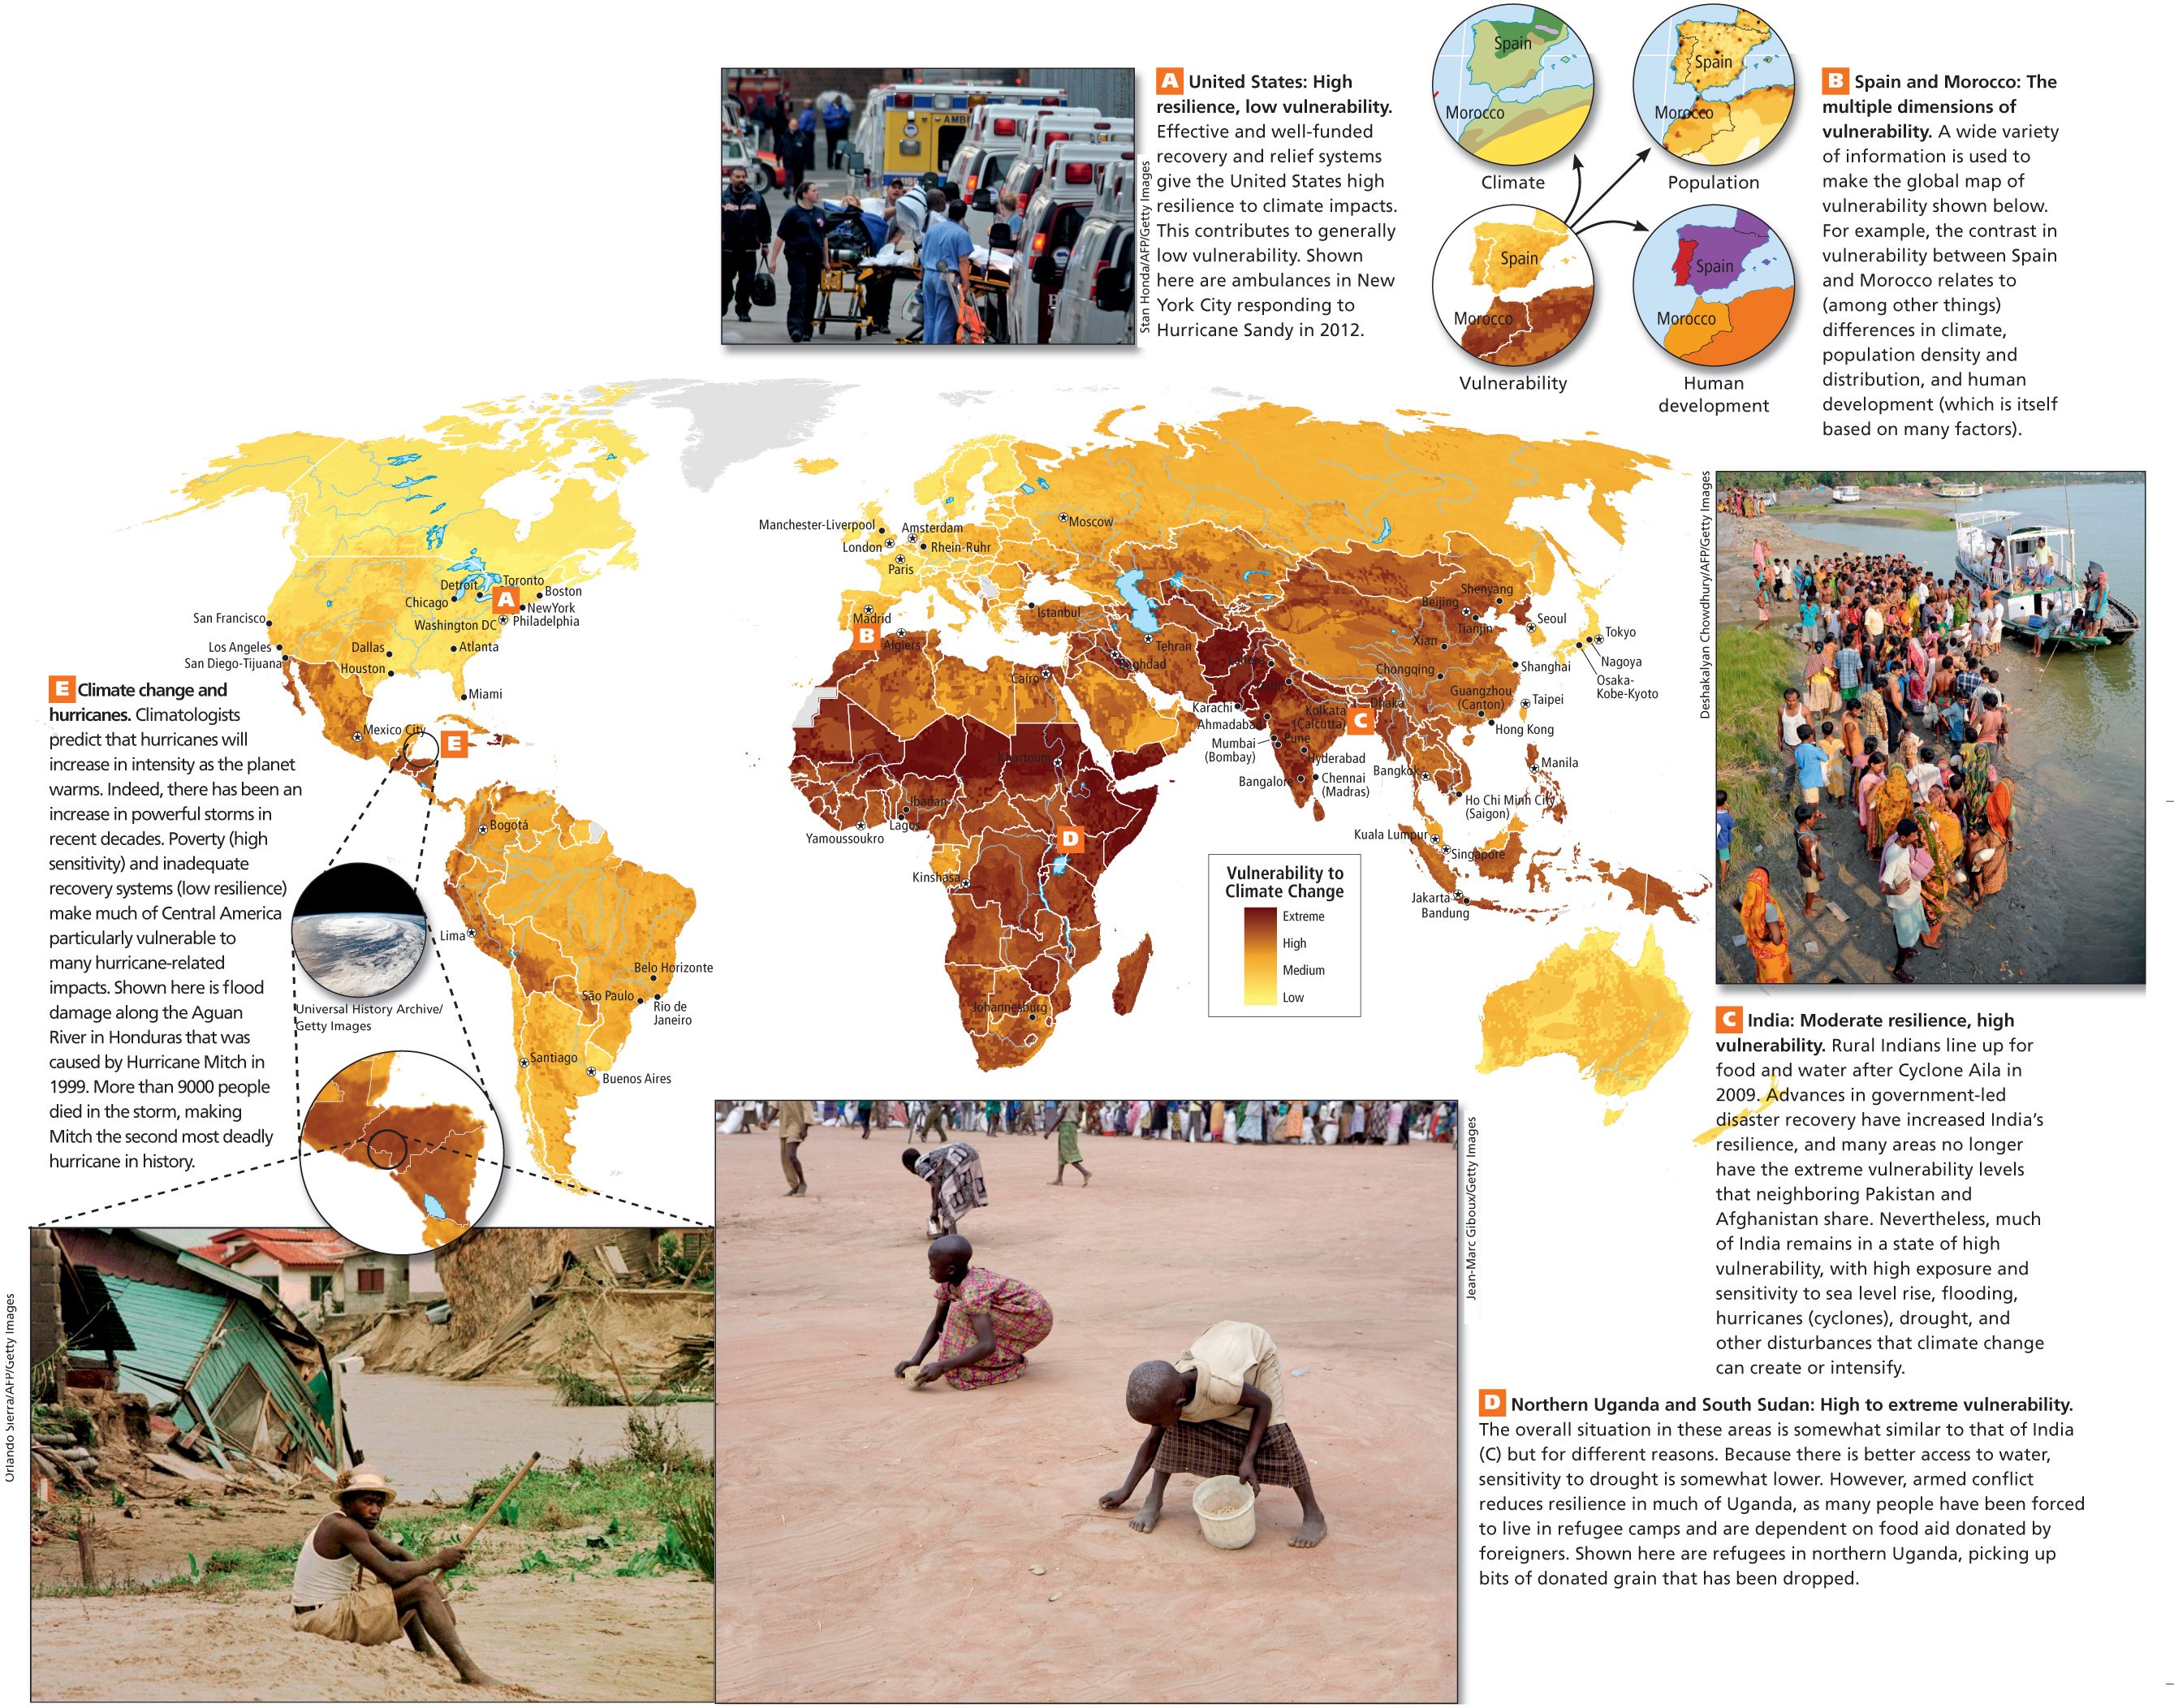
Over time, higher temperatures will shift northward in the Northern Hemisphere and southward in the Southern Hemisphere, bringing warmer climate zones to these regions. Such climate shifts could lead to the displacement of large numbers of people because the zones where specific crops can grow are likely to change. Animal and plant species that cannot adapt rapidly to the changes will disappear. Higher temperatures also will lead to stronger tornados and hurricanes because these storms are powered by warm, rising air (Figure 1.15). One example is Hurricane Sandy, the unusually large and powerful hurricane that struck the Atlantic Coast of North America in the autumn of 2012. In some areas, drought and water scarcity may also become more common since higher temperatures increase water evaporation rates from soils, vegetation, and bodies of water. Another effect of global warming is likely to be a shift in ocean currents. The result would be more chaotic and severe or dry weather, especially for places where climates are strongly influenced by ocean currents, such as western Europe (see “Vegetation and Climate” in Chapter 4).
THINKING GEOGRAPHICALLY
Use the Photo Essay above to answer these questions.
Question 1.5
kfw81VbILHdB9glo8ZZ/e1SFWUkoKRvaNp9PFxOqbfUzjn3psLyOjrZjJ2nfbv2ieQJwOJoNVi3f4okn9Vgy3HDH0IxuXhormhP+hnUFa6DQc7dHYCcqUp3++0yK4liiOJ+9gvayLdAvPGTEKXeXDsHWQbz4hR6yF7PGRGS7tVMVCDVQP7g2XbjLVSlDsK6+Is5nBGiEIbozvyzo+qJmnfDTqF3BuG+BGAKH/LlAOHXSSY5p2tSc0w==Question 1.6
J7gd129v3iQrWqzKvKEkOI3o3rWLajVONr8jqGx5sss2MvdtgDbNbwpf1A4EYZln+kKZGse4umPxcJvqomDeHuAptNz2GaYcCDwlPr68OBYGB6ohbkEDjnQcChGIQkML0CYt2OrE7gIiPLKNoFecNCoDYiS92dnQyY3rZGRngrMF83DFDfE3vmTKbTWd/UIoGkskmC9Y0i/MIaTOsA5R1VvbkoNMx4rKGtZqtK9MSi99qGX6e1UXtK15H9LwQ9SjdoGLZ+qi4nvb8TuSQuestion 1.7
tTFvHvyAzDgvQDbRnkUD0oPGCtjq1yKb50QjWTf8Ft6eFEmfppjAJFbCm5vDtROLv6gFIhE9icFdkijY4SP1lqAUdP9nbp8YQRM2m9cU1qp6dbRHFKgSN00GRwsNMNpfQuestion 1.8
buNQs44kyt46oEret3vhfA64dt1qgLkwHXf44yLz8nvjB56xvVnkUSig7Zqr6O6+7zXox2sEbwkDiPKd+fw/Q1Iw7KqCuEkMHxwIL//TaJWrjLSctUVDtA==Vulnerability to Climate Change
The vulnerability a place has to climate change can be thought of as the amount of risk its human or natural systems have of being damaged by such impacts as sea level rise, drought, flooding, or increased storm intensity. Many of these vulnerabilities are water related; others are not. Scientists who study climate change agree that while we can take measures to minimize temperature increases, we can’t stop them entirely, much less reverse those that have already occurred. We are going to have to live with and adapt to the impacts of climate change for quite some time. The first step in doing this is to understand how and where humans and ecosystems are especially vulnerable to climate change.
A CASE STUDY OF VULNERABILITY
Mumbai, India
Three concepts are important in understanding a place’s vulnerability to climate change: exposure, sensitivity, and resilience. Here we explore them in the context of the vulnerability to water-
Exposure refers to the extent to which a place is exposed to climate-
Over the short term, Mumbai benefits from more and better hospitals and emergency response teams than any other city in South Asia. Over the long term, Mumbai’s well-
One effort at understanding the global pattern of vulnerability to climate change can be seen in Figure 1.15, which features a map of vulnerability to climate change and photos of the types of problems that are already being seen (see Figure 1.15A, C–E). One pattern is that places with low levels of human development tend to be more vulnerable to climate change. For example, many of the qualities that make Mumbai more sensitive to sea level rise are less present in urban areas in highly developed countries. New York City has virtually none of the large, unplanned lowland slums found in Mumbai. In addition, numerous world-
24
Responding to Climate Change
In 1997, an agreement known as the Kyoto Protocol was adopted. The protocol called for scheduled reductions in CO2 emissions by the industrialized countries of North America, Europe, East Asia, and Oceania. The agreement also encouraged, though it did not require, developing countries to curtail their emissions. One hundred eighty-
Kyoto Protocol an amendment to a United Nations treaty on global warming, the Protocol is an international agreement, adopted in 1997 and in force in 2005, that sets binding targets for industrialized countries for reducing emissions of greenhouse gases
In December 2009 in Copenhagen, 181 countries worked on a plan to halt the rising concentrations of CO2 in the atmosphere by 2020. However, wealthy nations did not offer to curb emissions sufficiently enough to make a difference. The only progress that came out of Copenhagen was an agreement to help developing countries create clean-
In December 2011, the UN Framework Convention on Climate Change (UNFCCC) convened, this time in Durban, South Africa, again with the goal of controlling emissions. After grueling negotiations, all 190 countries, including the top three emitters—
THINGS TO REMEMBER
Human activities, such as burning of fossil fuels and deforestation, create large amounts of carbon dioxide, methane, and other greenhouse gases that trap heat in the atmosphere, causing global warming.
The vulnerability a place has to climate change can be thought of as the amount of risk its human or natural systems have of being damaged by such impacts as sea level rise, drought, flooding, and increased storm intensity.
25
26
There has been little progress in making global agreements to control CO2 emissions.
While renewable resources are relatively underutilized today, many analysts predict a rapid increase in their use in coming decades.