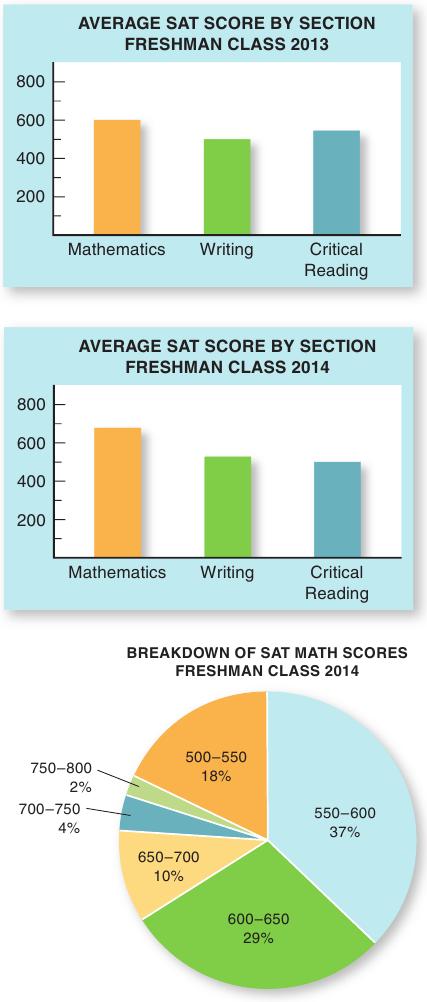
FIGURE 14.1
SAMPLES OF EFFECTIVE GRAPHS
Bar graphs use bars of varying lengths to make comparisons. Pie charts depict the division of a whole.