Graphing The Data: The Functional Response Of Wolves
In Gates of the Arctic National Park in Alaska, researchers monitored the densities of wolves and their major prey, including caribou (Rangifer tarandus). To understand whether the wolves could potentially regulate the growth of the caribou population, they wanted to know the shape of the wolves’ functional response. They could do this by determining the number of caribou killed by wolves in different areas and at different times of the year.
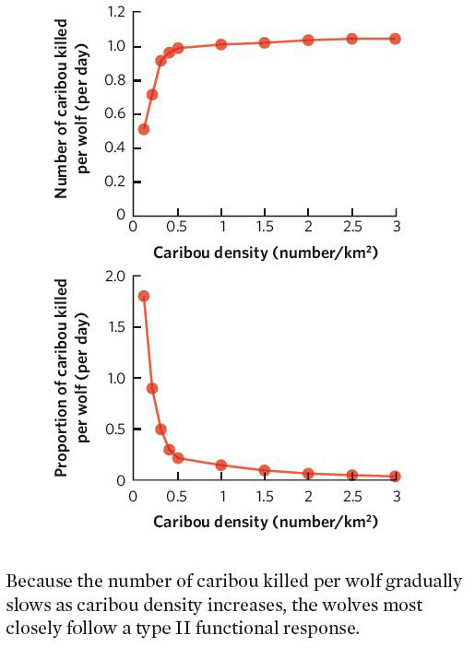
Using the data from this study, plot the relationship between caribou density and the number of caribou killed per wolf. Then plot the relationship between caribou density and the proportion of caribou killed per wolf.
Based on your graphs, what type of functional response do the wolves have?
|
WOLF AND CARIBOU DATA |
||
|---|---|---|
|
CARIBOU DENSITY (NUMBER/km2) |
NUMBER OF CARIBOU KILLED PER WOLF (PER DAY) |
PROPORTION OF CARIBOU KILLED PER WOLF (PER DAY) |
|
0.1 |
0.50 |
1.80 |
|
0.2 |
0.70 |
0.90 |
|
0.3 |
0.90 |
0.50 |
|
0.4 |
0.95 |
0.30 |
|
0.5 |
0.98 |
0.22 |
|
1.0 |
1.00 |
0.15 |
|
1.5 |
1.01 |
0.10 |
|
2.0 |
1.02 |
0.07 |
|
2.5 |
1.03 |
0.05 |
|
3.0 |
1.03 |
0.04 |