Graphing The Data: The Decomposition of Organic Matter
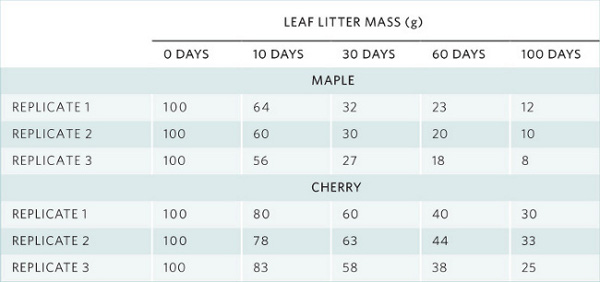
As we have seen in this chapter, dead organic matter commonly decomposes in a pattern that follows a negative exponential curve. To study decomposition rates of leaves in a stream, scientists placed leaf bags into a stream and retrieved them over time. They conducted three replicates of this experiment, and obtained the data shown in the table.
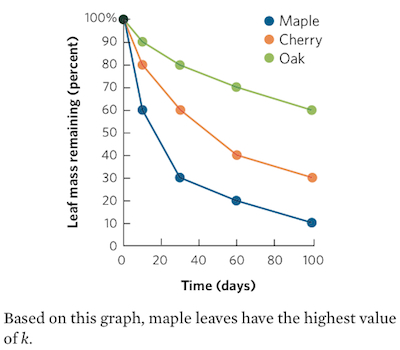
For each species of leaf litter, calculate the mean amount of litter remaining at each timepoint and then graph the mean amount of litter remaining over time using a scatter plot.