The number of species increases with area
When we consider large-scale ecology, we see that larger aquatic or terrestrial areas contain more species. In this section, we discuss examples of this phenomenon from a variety of systems and then explore the mathematical relationship between area and species richness. We will then consider the underlying processes that cause the positive relationship between area and species richness.
Species–Area Relationships
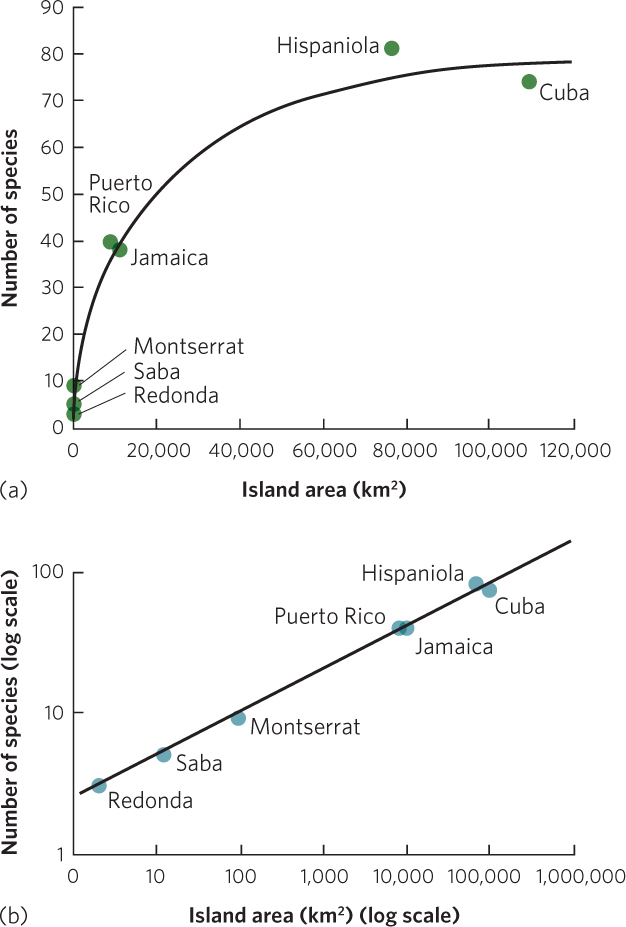
In a classic study of species diversity, Robert MacArthur and E. O. Wilson examined the patterns of species richness in taxonomic groups living on islands of different sizes. When they plotted the species richness of different islands against the size of the islands, they found that larger islands had a greater species richness. For example, as you can see in Figure 22.4a, the number of amphibian and reptile species living on islands in the West Indies increases with island size.
520
The observation that larger areas tend to contain more species has led to the concept of the species–area curve. The species-area curve is a graphical relationship in which increases in area (A) are associated with increases in the number of species (S). This curve can be described by the following equation:
Species–area curve A graphical relationship in which increases in area (A) are associated with increases in the number of species (S).
S = cAz
where c and z are constants fitted to the data. To make it easier to work with this equation in the form of a graph, we can take the logarithm of both sides:
log S = log c + z log A
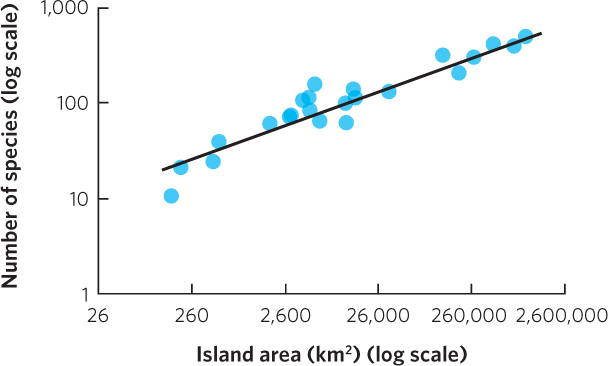
This is the equation for a straight line with a y intercept of log c and a slope of z. For example, Figure 22.4b plots the same amphibian and reptile data using axes on a log scale. A similar linear relationship can be seen in another collection of data by MacArthur and Wilson in which they examined the number of bird species living on the Sunda Islands in Malaysia, the Philippines, and New Guinea. As you can see in Figure 22.5, when the data are plotted on a log scale, the number of bird species linearly increases with island size.
521
Across many different groups of organisms, the relationship between log A and log S typically has a slope within the range of z = 0.20 to 0.35 across scales of 1 m2 to the area of an entire state or province or a country of a modest size. This relatively narrow range of slope values across different studies and different taxa suggests that the relationships between species richness and island area reflect similar processes.
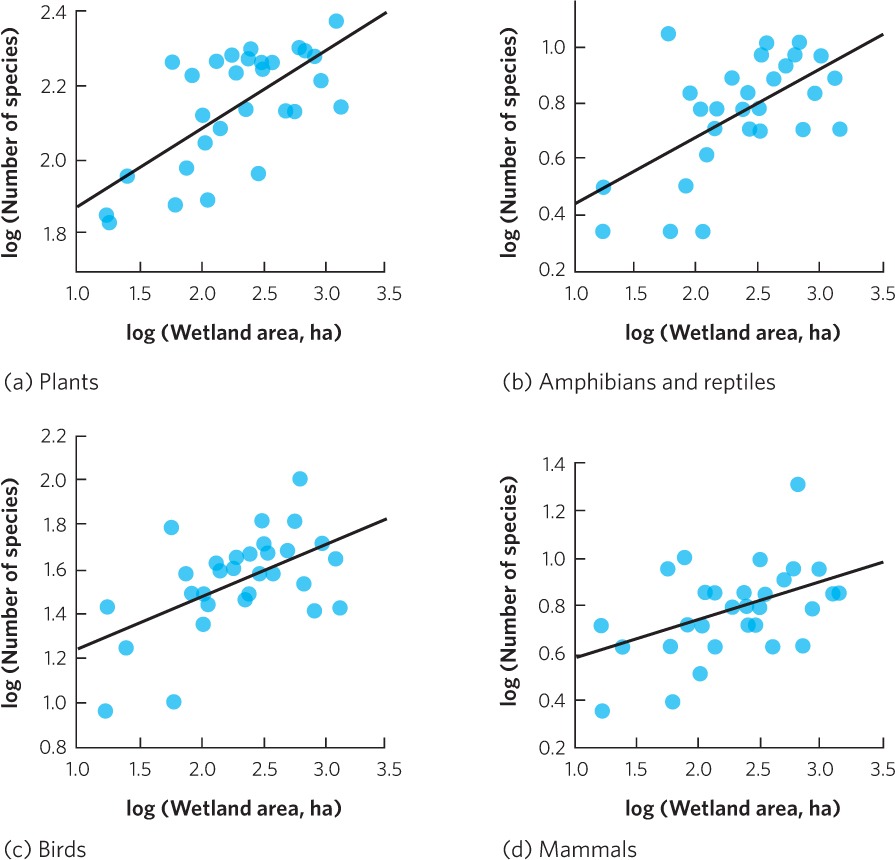
Oceanic islands provide good examples of the species–area relationship, but the pattern can also be observed in a wide range of ecosystems. For example, researchers in Ontario, Canada, surveyed the species living in 30 wetlands of different sizes. As shown in Figure 22.6, they found that as wetland area increased, there was a corresponding increase in the number of species of plants, amphibians, reptiles, birds, and mammals. As you can see, the positive correlation between area and species richness is common in nature.
Habitat Fragmentation
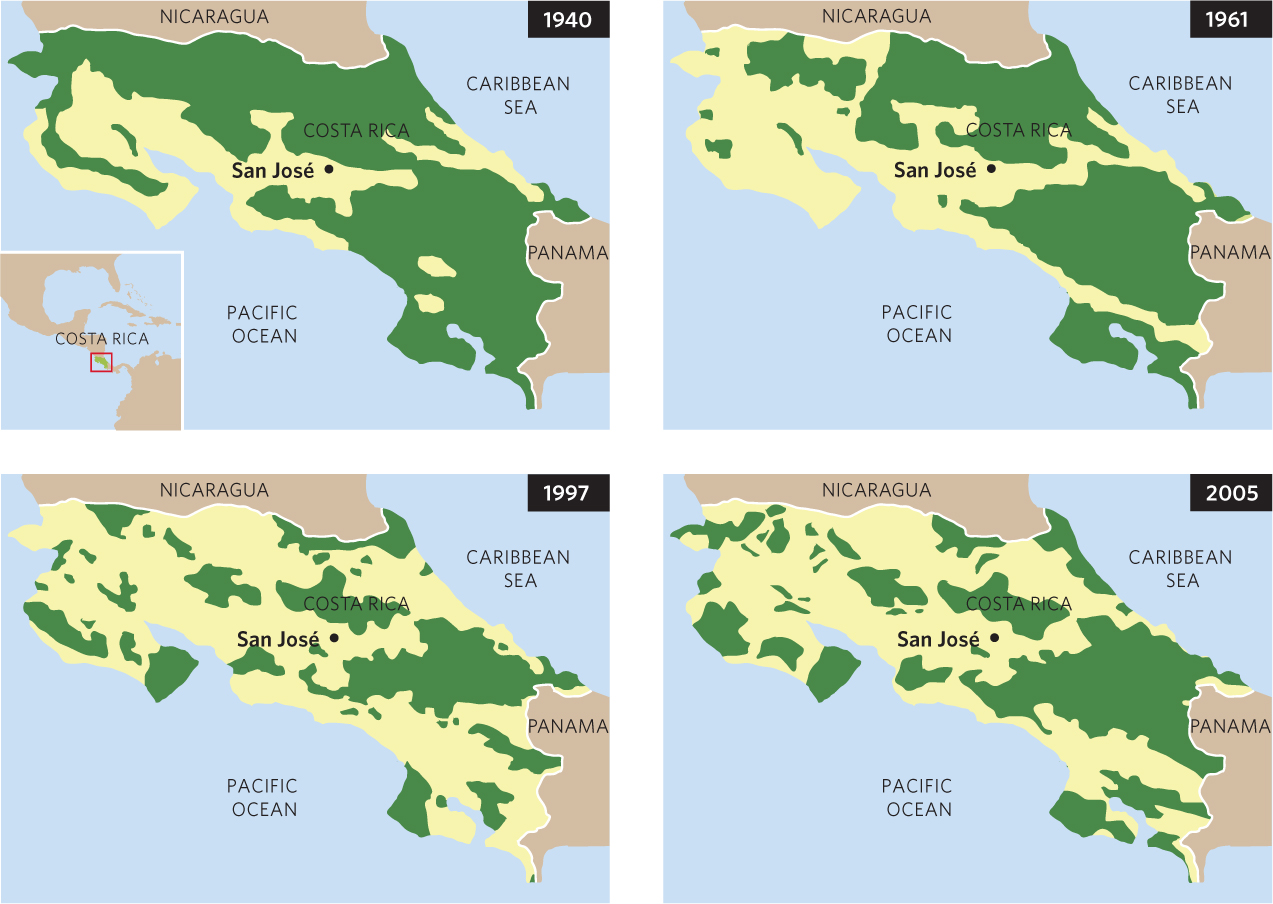
While natural processes such as fires and hurricanes can cause habitats to become fragmented, human activities have caused widespread fragmentation of large habitats throughout the world. For example, in the Central American nation of Costa Rica, the forests in 1940 covered much of the country and existed as a large, continuous habitat. As human populations and their associated activities increased, the forests were cleared on a continuing basis, as shown in Figure 22.7. By 2005, much of the forested area had been cleared and the forests that remained existed in many small fragments.
Fragmentation of a large contiguous habitat creates several effects: the total amount of habitat decreases, the number of habitat patches increases, the average patch size decreases, the amount of edge habitat increases, and patch isolation increases. Conversely, in the habitat matrix between the fragments, such as cleared fields between forest fragments, the total area increases and the matrix becomes more continuous. Ecologists are particularly interested in how the creation of isolated habitat patches with different sizes and shapes influences biodiversity and how habitat corridors and the quality of the matrix between habitat fragments affect the rate of species turnover.
522
ANALYZING ECOLOGY
Estimating the Number of Species in an Area
Species accumulation curve A graph of the number of species observed in relation to the number of individuals sampled.
As we have seen, ecologists often need to estimate how many species exist in an area. Since counting every individual is rarely possible, we must take a sample of an area to estimate how many species are present. One way to estimate the number of species in a sample is to graph the number of species that we observe as we increase our sample size. One would expect that the more we sample, the closer we will get to knowing the actual number of species in an area. Eventually, the curve will reach a plateau so that any additional sampling will not discover additional species. A graph of the number of species observed in relation to the number of individuals sampled is known as a species accumulation curve.
A second way to estimate the number of species in an area is based on the number of rare species that are detected. When we sample many individuals in a community, we typically end up with a high number of individuals for each of the common species but we may detect only one or two individuals of rare species.
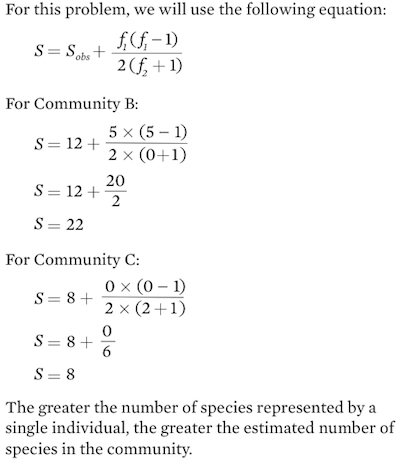
We can estimate the number of species actually living in an area (S) by sampling the community to determine how many species are observed (Sobs), how many species are represented by two individuals (f2), and how many are represented by one individual (f1). In essence, species represented by two individuals are likely to be more common in the community than species represented by single individuals. We can therefore estimate the number of actual species that live in a community by starting with how many species we have observed and multiplying this by a ratio that incorporates the number of species represented by one versus two individuals:
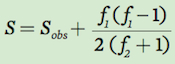
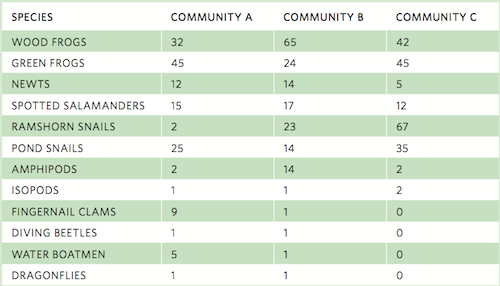
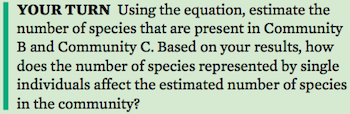
As you can see in this equation, the estimated number of species in a community increases with an increase in the number of species represented by a single individual and decreases with an increase in the number of species represented by two individuals. For example, consider the table on the following page that lists the number of individuals observed for 12 species sampled from three pond communities.
Using the data for Community A, we can estimate the actual number of species. In this community, we have observed 12 species. Two individuals were observed for each of two species whereas one individual was observed for each of three species. Using our equation above:
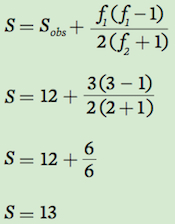
Based on these results, we conclude that although we observed 12 species, we estimate that the community actually contains 13 species.
Effects of Fragment Size
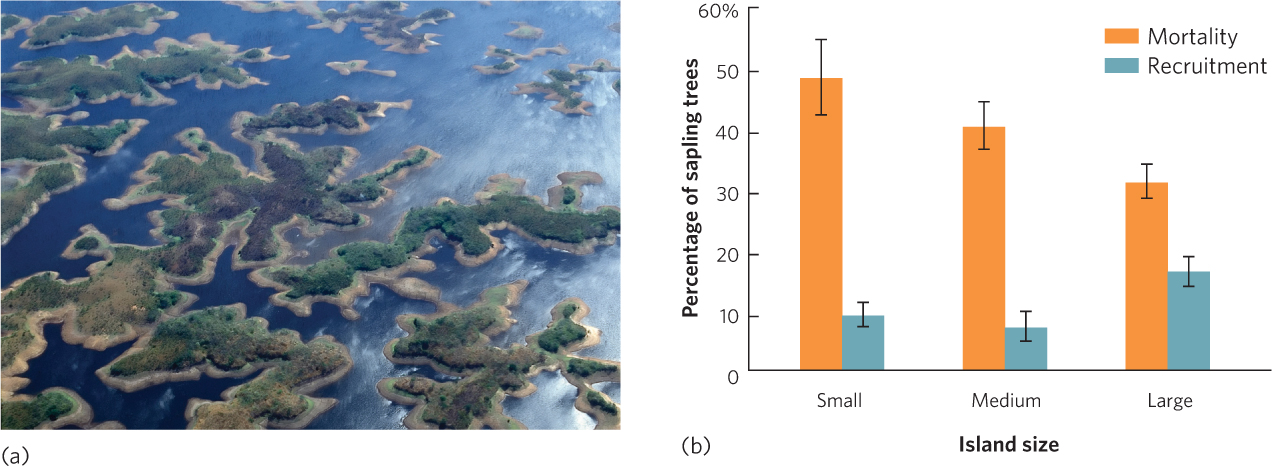
The reduction in habitat size that comes with fragmentation commonly causes a decline in species diversity. This happens because each fragment supports smaller populations of species than existed in the original larger habitat and, as discussed in Chapter 13, smaller populations experience higher rates of extinction (see Figure 13.13). For example, in eastern Venezuela a large river was dammed to create a 4,300-km2 lake known as Lago Guri. The region had been composed of a mixture of grazed fields and tropical forests, but after the dam caused the region to flood, hundreds of high points in the landscape became islands in the newly formed lake, as shown in Figure 22.8a. The smallest islands did not contain enough prey to sustain the large vertebrate predators, so predators isolated on the small islands eventually went extinct. These extinctions caused a chain of events that affected the species that remained on the islands. The extinction of the large predators allowed the herbivores on the islands, such as leaf-cutter ants, iguana lizards, and howler monkeys (Alouatta seniculus), to increase. The population explosion of these herbivores affected the island plants. As you can see in Figure 22.8b, greater abundance of herbivores on smaller islands caused higher mortality in existing sapling trees and reduced the recruitment of new trees into the sapling stage.
Effects of Fragment Edges
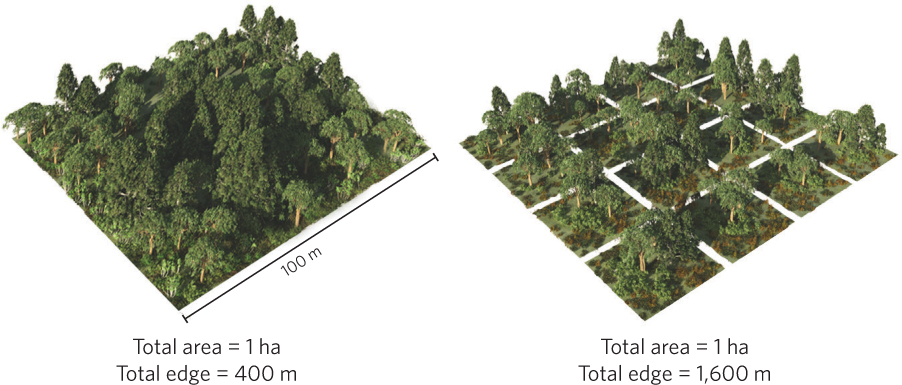
As you may recall from Chapter 18, when habitats are fragmented they produce ecotones, which are regions with distinct species composition and environmental conditions over a relatively short distance. When a habitat is fragmented, an ecotone is formed along the edges of the habitat. Increases in fragmentation cause an increase in the amount of edge habitat compared to the amount of edge present in the original unfragmented habitat. For example, consider a single square habitat with an area of 1 ha compared to the same total area divided into 16 smaller square habitats. As illustrated in Figure 22.9, the single large habitat would have 400 m of edge whereas the 16 smaller habitats would have 1,600 m of edge. Round habitats have the lowest ratio of edge to area while long, skinny ovals or rectangles have much higher edge to area ratios.
523
524
An increase in edge habitat changes both the abiotic conditions and the species composition of a habitat. In a fragmented forest, for instance, the edge of a newly created fragment experiences greater sunlight, warmer temperatures in the summer, and higher rates of evaporation. These changes can make the edge of the forest less suitable to many forest species and more suitable to others.
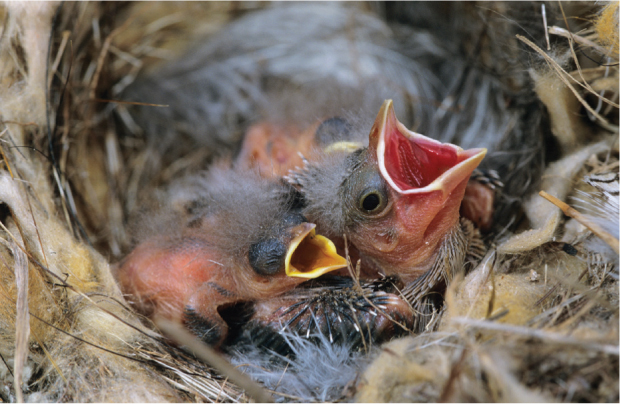
Species that prefer edge habitat increase in abundance when fragmentation occurs, and this can affect other species living in the fragment. For example, in the southern United States the bronzed cowbird (Molothrus aeneus) has increased with habitat fragmentation. This bird is a nest parasite because it reproduces by placing its eggs into the nests of other bird species (Figure 22.10). This allows it to produce offspring without providing parental care but reduces the number of offspring the host bird can raise. While cowbirds spend much of their time living in fields, they enter the forest edge to find nests of forest birds in which they deposit their eggs. Researchers have found that as forest fragmentation has created more edge habitat, more nests are parasitized by the cowbirds. Subsequently, the reproduction and population sizes of the host species of songbirds have declined.
Fragmentation can also have consequences for human health. You may recall from Chapter 15 that human exposure to Lyme disease depends on a complex food web that starts with mice and chipmunks serving as hosts for newly hatched ticks that carry the pathogenic bacteria. In forest fragments in the northeastern United States, the abundance of many vertebrate animals has declined, but the abundance of the white-footed mouse has increased, probably because most of the mouse’s competitors and predators cannot live in the smallest forest fragments. When researchers surveyed mouse populations from forest fragments of different sizes, they found that the smallest forest fragments had the highest mouse densities, and thus the highest tick densities. The researchers also found that mice living in the smallest fragments had the highest proportion of ticks infected with the Lyme disease bacterium. In short, the fragmentation of forests due to human activities has created a landscape that makes us more likely to be exposed to Lyme disease.
Corridors, Connectivity, and Conservation
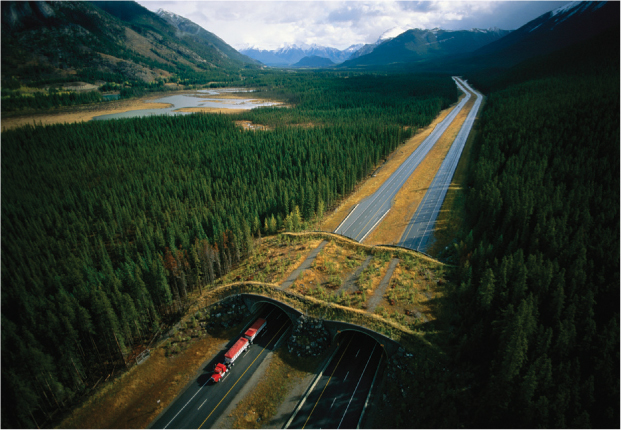
In Chapters 11 and 12 we touched on the importance of considering geographic scales larger than the local area. In our discussion of metapopulations, we emphasized that many populations are divided into habitat fragments and that the regional populations persist because each patch is connected by the occasional dispersal of individuals between patches. We saw an example of this in Chapter 11 when we discussed the recovery of the collared lizard. This lizard depended on patches of open habitat, known as glades, as well as corridors between the glades through which they could disperse. Corridors facilitate movement, which can save declining populations of many species from local extinction. They also increase gene flow and genetic diversity within populations, which counteract the negative effects of genetic bottlenecks and genetic drift. Corridors can simply be pieces of preserved habitat or they can be constructed, such as corridors built to let animals cross over a highway (Figure 22.11).
525
Although corridors can rescue declining populations by adding new colonists that bring genetic variation, they can also have unintended downsides. For example, corridors built to help conservation of a particular species can facilitate the movement of predators (including poachers), competitors, and pathogens that are harmful to conservation efforts. Therefore, resource managers must carefully consider the costs and benefits of developing corridors among habitat before spending time and money to implement this strategy.
Stepping stones Small intervening habitat patches that dispersing organisms can use to move between large favorable habitats.
The importance of corridors is greatest for those organisms that require a continuous connection to move between habitat fragments. However, organisms such as birds and flying insects can pass over stretches of inhospitable habitat matrix and therefore may not need a continuously connected corridor. Instead, these species can move between large patches of favorable habitat if they have access to small intervening patches where they can stop to rest or forage. These small intervening patches that dispersing organisms can use to move between large favorable habitats are known as stepping stones.
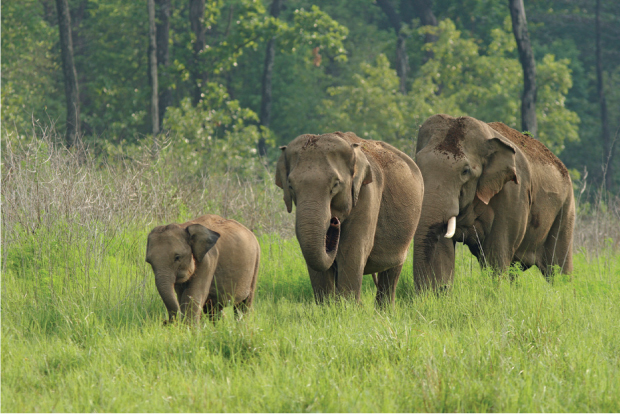
The role of habitat corridors and stepping stones that can facilitate the movement of organisms among patches of fragmented habitat has spurred major efforts at preservation. India, for example, is home to nearly 60 percent of all Asian elephants (Elephas maximus), which live in several national parks and protected areas. These areas are the fragmented remains of a much larger and contiguous habitat. The World Land Trust and the Wildlife Trust of India are working together to protect important corridors between the protected habitat fragments to ensure the long-term persistence of the elephants (Figure 22.12). Although elephants are charismatic animals that can draw attention to conservation needs, these corridors are likely to assist in the conservation of other charismatic species including tigers (Panthera tigris) and Himalayan black bears (Ursus thibetanus), as well as many less-charismatic species.
The Matrix of Habitats Between Fragments
As you may recall from our discussion of metapopulations in Chapter 11, the quality of the matrix habitat that lies between favorable fragments of habitat is a key factor that helps determine whether organisms can move between these favorable fragments. Some habitats in the matrix may contain favorable conditions for the movement of organisms whereas others might be inhospitable. For example, researchers in Colorado mapped the locations of meadows, willow thickets, and coniferous forests in a valley and then studied the movements of more than 6,000 individual butterflies from six taxonomic groups. Butterflies feed in meadows and when moving from one meadow fragment to another they must pass through a matrix containing willow thickets and coniferous forests. The researchers captured butterflies in meadows and wrote a unique number on a wing of each butterfly before releasing it. Researchers then recaptured the butterflies to determine whether they exhibited a preference for dispersing through the willow thickets or through the coniferous forests. There was no preference in two of the six taxonomic groups. These two groups reflected the two extremes in flying ability; one group rarely moved out of a meadow while the other group was composed of excellent fliers that easily navigated both intervening habitats. In contrast, individuals from the other four taxonomic groups were three to 12 times more likely to move between meadows via willow thickets than through coniferous forests. This confirms that some species of butterflies have distinct preferences for dispersing through particular habitats and these preferences are related to their ease of dispersal. From this example we can see that the matrix habitats can affect the movements of organisms among fragments.
526