Animals and plants face the challenge of water and salt balance
Salt Balance in Aquatic Animals
Solute A dissolved substance.
It might surprise you to learn that animals in an aquatic environment need specialized mechanisms to maintain the proper amount of water in their bodies. To understand why, we need to recognize that the water surrounding an aquatic animal and the water inside its body contain dissolved substances, known as solutes. These solutes affect the movement of water in and out of an organism. The movement of water occurs at the cellular level, where water passes across cell membranes from regions of low solute concentration to regions of high solute concentration. At the same time, solutes attempt to move across membranes to equalize the concentration of solutes. Cell membranes typically do not allow the free movement of large solute molecules such as carbohydrates and most proteins. Membranes that allow only particular molecules to pass through—for example, water and small solute ions and molecules—are known as semipermeable membranes. Cells are able to transport ions and small molecules through a membrane against a concentration gradient to maintain their concentrations, a process known as active transport. Active transport expends energy because it requires the cell to work against the concentration gradient of solutes.
Semipermeable membrane A membrane that allows only particular molecules to pass through.
Active transport Movement of molecules or ions through a membrane against a concentration gradient.
Osmosis The movement of water across a semipermeable membrane.
The difference between the solutes inside and outside the body of an aquatic animal makes it difficult to maintain the right amount of water. The osmotic potential generated by an aqueous solution depends on its solute concentration, which is measured as the number of solute molecules in a given volume of water. When the water inside a cell has a higher concentration of solutes than the water outside, water tries to move into the cell from the surrounding environment. In contrast, when the water inside a cell has a lower concentration of solutes than the water outside, water tries to move out of the cell. The movement of water across a semipermeable membrane is called osmosis. The force with which an aqueous solution attracts water by osmosis is known as its osmotic potential, which is expressed in megapascals (MPa), a unit of pressure.
Osmotic potential The force with which an aqueous solution attracts water by osmosis.
41
Osmoregulation The mechanisms that organisms use to maintain proper solute balance.
The challenge for most aquatic animals is that they live in water with a solute concentration that differs from the solute concentration of their bodies. If they take in too many solutes, they must rid themselves of the excess. If they take in too few solutes, they must make up the deficit. Maintaining a particular solute concentration in the body is important because solute concentrations affect the way proteins interact with other molecules. In short, altered solute concentrations can disrupt cell functions. Because solutes determine the osmotic potential of body fluids, the mechanisms that organisms use to maintain a proper solute balance are referred to as osmoregulation.
Adaptations in Freshwater Animals
Hyperosmotic When an organism has a higher solute concentration in its tissues than the surrounding water.
We have seen that the water balance of aquatic animals is closely tied to the concentrations of salts and other solutes in their body tissues and in the environment. The body fluids of vertebrate animals have an osmotic potential of about –0.4 MPa. In comparison, fresh water has an osmotic potential close to 0 MPa and seawater has an osmotic potential of –1.2 MPa. Freshwater animals, such as bass and trout, that have higher solute concentrations in their tissues than the surrounding water are said to be hyperosmotic compared to their freshwater environment.
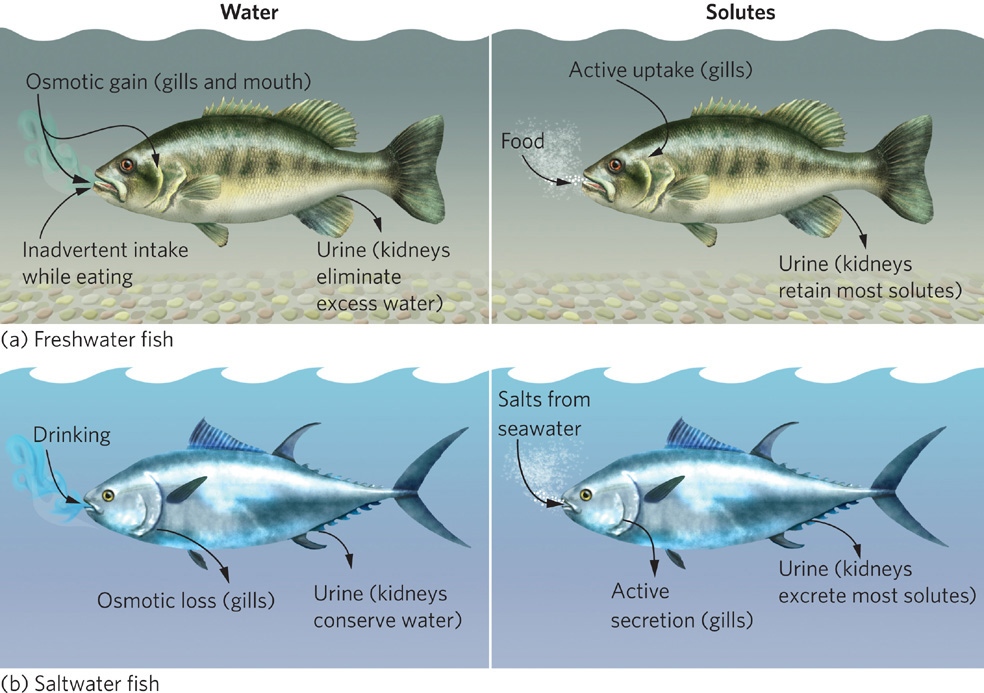
Because water and solutes move in the direction that will equalize the concentrations of solutes on both sides of a membrane, a hyperosmotic organism faces a constant challenge: water attempts to enter its body while solutes attempt to leave. Figure 2.10a shows how hyperosmotic fish regulate the balance of solutes in their tissues. Freshwater fish continuously gain water both when they consume food and when osmosis occurs across the mouth and gills, which are the most permeable tissues exposed to the water. Fish respond to this influx of water by eliminating the excess water through their urine. They add solutes to their bloodstream by using their gill cells to actively transport solutes into the body from the water. In addition, their kidneys remove ions from their urine.
42
Adaptations in Saltwater Animals
Hyposmotic When an organism has a lower solute concentration in its tissues than the surrounding water.
Saltwater animals—such as whales, sardines, and plankton—have lower solute concentrations in their tissues than exists in the surrounding water. Such organisms are said to be hyposmotic compared to their saltwater environment. Hyposmotic organisms face a constant challenge to maintain the balance of water and solutes in their tissues. As shown in Figure 2.10b, water tries to leave their bodies and solutes try to enter. To replace the loss of water, saltwater animals drink large amounts of saltwater and release only small amounts of urine. To counteract the accompanying influx of solutes, the excess solutes are actively excreted out of the body using the kidneys and, in the case of fish, the gills.
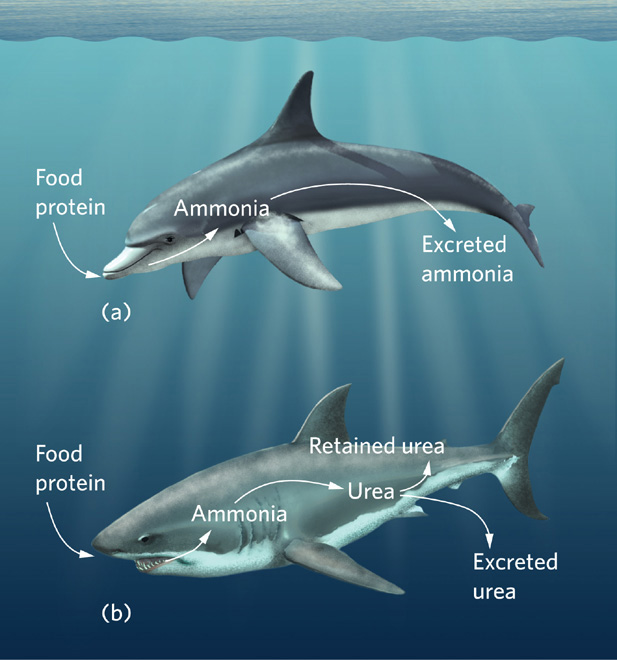
Some sharks and rays have evolved a unique adaptation to the challenge of water balance in a saltwater environment. Like all vertebrate animals, when sharks and rays digest proteins, they produce ammonia as a by-product, as shown in Figure 2.11. Aquatic vertebrates excrete ammonia in their urine, whereas terrestrial vertebrates generally convert this ammonia to urea, which they then excrete at high concentrations in their urine. Interestingly, sharks and rays convert ammonia into urea too, but they do not excrete all of it. Unlike terrestrial vertebrates, which maintain concentrations of urea below 0.03 percent in their bloodstream, sharks and rays actively retain urea and allow its concentration to increase to 2.5 percent in their bloodstream. The retained urea raises the osmotic potential of their blood to that of seawater without any increase in the concentrations of sodium and chloride ions. Consequently, the movement of water across the animal’s body surface becomes balanced in relation to the surrounding saltwater, with neither gain nor loss. This adaptation frees sharks and rays from having to drink salt-laden water to replace water lost by osmosis.
Freshwater species of rays do not accumulate urea in their blood, though they are similar to their marine cousins in other respects. This confirms the importance of urea for osmoregulation in saltwater species. Most vertebrates do not retain much urea in their bloodstream because urea impairs protein function. However, sharks, rays, and many other marine organisms that use urea to maintain their water balance have an additional adaptation: they accumulate high concentrations of a compound called trimethylamine oxide to protect proteins from the harmful effects of urea.
Certain environments pose unusual osmotic challenges. For instance, the salt concentrations in some landlocked bodies of water greatly exceed those of the ocean. This is particularly common in arid regions where, because evaporation outpaces precipitation, very high concentrations of solutes accumulate in the water. The Great Salt Lake in Utah, for example, contains 5 to 27 percent salt, depending on the water level. This is up to eight times more salt than in seawater. The osmotic potential of the water in the Great Salt Lake—in excess of –10 MPa—would cause most organisms to shrivel. However, a few aquatic creatures, such as brine shrimp, have adaptations that allow them to thrive in these conditions by excreting salt at a very high rate. This level of excretion comes at a high energetic cost, which they meet by feeding on the abundant photosynthetic bacteria that live in the lake.
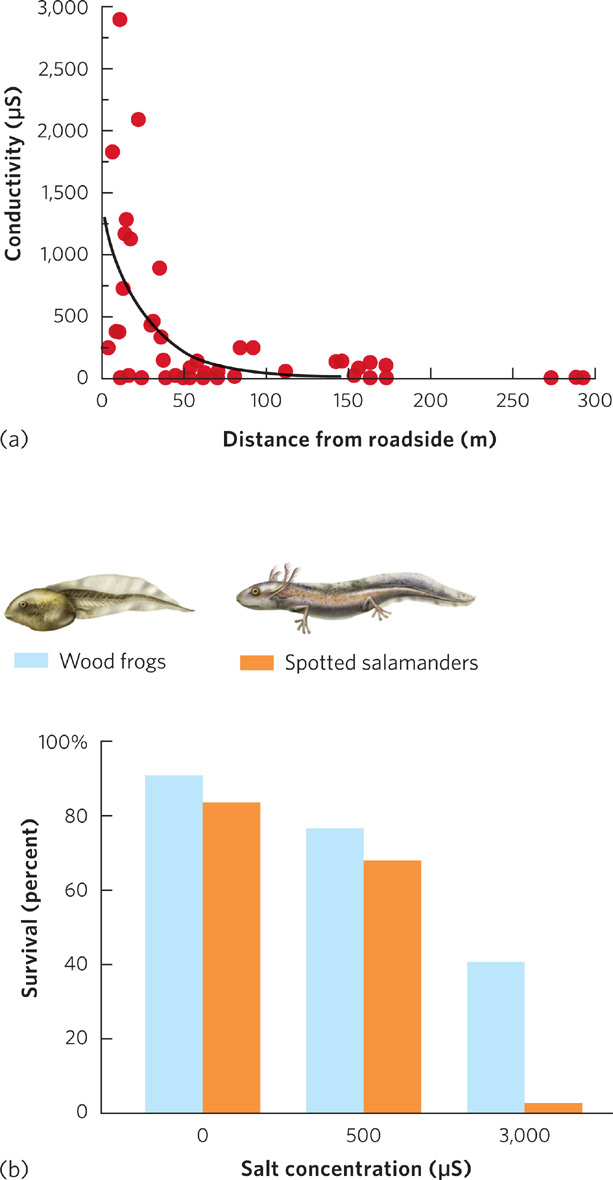
The ability of an organism to cope with the osmotic potential of its environment reflects the outcome of evolutionary processes. As we will discuss in Chapter 4, some environments naturally experience large fluctuations in osmotic potential and the organisms living in these environments have evolved ways to adjust to these fluctuations. When changes in osmotic concentrations are not within the natural range that organisms have experienced over evolutionary time, however, individuals typically lack appropriate adaptations and can be harmed. For example, in the northern United States, various mixtures of salts are spread on roads to melt the ice and snow to provide safer driving conditions during winter weather. With the arrival of warmer spring weather, however, all of this salt has to go somewhere. In 2008, researchers reported on the concentrations of road salt in ponds inhabited by amphibians at different distances from salt-treated roads. Because salt ions allow electricity to be conducted through water, the concentration of salt can be measured in units of microsiemens (µS). As you can see in Figure 2.12a, ponds close to roads had salt concentrations up to 3,000 µS, which corresponds to 0.12 percent salt. Ponds at least 200 m from a road had essentially 0 µS. The researchers then conducted experiments in which they exposed larval wood frogs (Rana sylvatica) and spotted salamanders (Ambystoma maculatum) to a range of relevant salt concentrations, from 0 µS to 3,000 µS. The data, shown in Figure 2.12b, revealed that increases in salt concentration caused the larvae of both species to die in high numbers. Not having been exposed to high salt concentrations during their evolutionary history, these freshwater organisms are not adapted to these stressful conditions and are unable to survive in them.
43
Salt Balance in Aquatic Plants
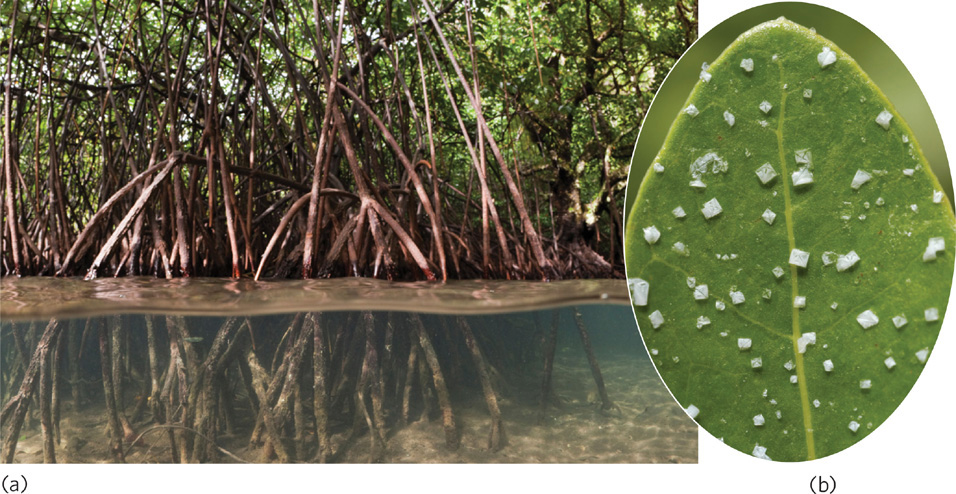
Some aquatic plants also face major challenges of salt balance. Mangrove trees, for example, grow on coastal mudflats that are inundated by saltwater during high tides (Figure 2.13a). Not only does this habitat impose a high salt load on the trees, but the high osmotic potential of the saltwater environment also makes it difficult for the roots to take up water. To counter these osmotic problems, many mangroves maintain high concentrations of organic solutes—various amino acids and small sugar molecules—in their roots and leaves to increase their osmotic potential so that water will diffuse into the plant’s tissues. In addition, mangroves possess salt glands in their leaves that can secrete salt by active transport to the exterior surface of the leaf (Figure 2.13b). Many mangrove species also exclude salts from their roots by active transport. Because relatively few species of terrestrial plants have evolved this adaptation, mangrove forests do not contain numerous species of plants.
44
ANALYZING ECOLOGY
Standard Deviation and Standard Error
When the researchers tested the effects of road salt on larval amphibians, they exposed groups of larvae to three salt concentrations and replicated the experiment five times. In the previous chapter, we discussed how ecologists use data from such manipulative experiments to determine how different factors affect the means and variance of the variables that are measured. While the variance is a useful measure of how consistent measurements are among replicates, ecologists also use several other related measures of variation, including the sample standard deviation and the standard error of the mean. Each of these can be calculated from a measure of sample variance (s2) as we discussed in Chapter 1.
Sample standard deviation A statistic that provides a standardized way of measuring how widely data are spread from the mean.
When data are collected from limited samples of a much larger distribution of data, we can gain additional information about the data by calculating a sample standard deviation. The sample standard deviation gives us a standardized way of measuring how widely our data are spread from the mean. Large sample standard deviations indicate that many of our data are spread far from the mean. Small sample standard deviations indicate that most of our data points are close to the mean value.
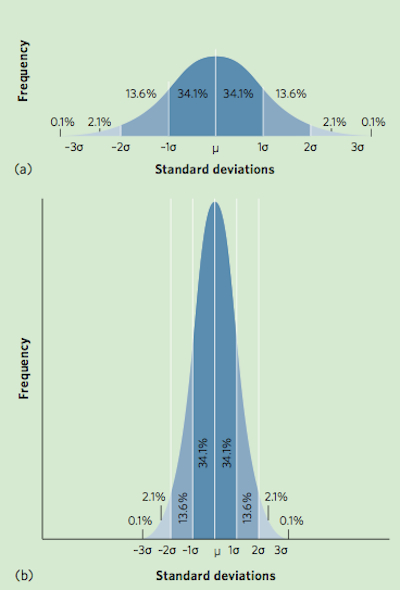
If data are normally distributed—that is, if they follow a bell-shaped curve like the one in the figure at right—then about 68 percent of our data will fall within one standard deviation of the mean. Moreover, about 95 percent of our data will fall within two standard deviations of the mean and 99.7 percent of our data will fall within three standard deviations of the mean. For data that have a wide distribution of frequencies, as in the upper figure, the standard deviation value will be large. For data that have a narrow distribution of frequencies, as in the lower figure, the standard deviation value will be small.
The sample standard deviation, denoted as s, is defined as the square root of the sample variance:

Standard error of the mean A measurement of variation in data that takes into account the number of replicates that were used to measure the standard deviation.
The standard error of the mean is a useful measurement of variation in our data because it takes into account the number of replicates that were used to measure the standard deviation. The higher the number of replicates, the more precise the estimate we should have of the mean. As a result, an increase in the number of replicates in a given experiment produces a decrease in the standard error of the mean. As we will see in later chapters, the standard error of the mean is commonly used to determine whether two means are significantly different from each other.
The standard error of the mean (denoted as SE) is defined as the sample standard deviation divided by the square root of the number of observations or replicates (denoted as n):

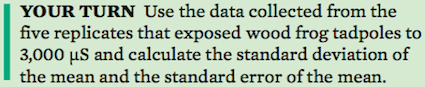
Consider the following set of observations on the percentage of surviving wood frogs that were exposed to salt concentrations of 0 μS or 3,000 μS:
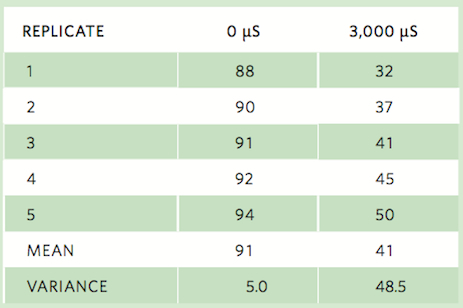
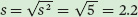
Using the data from the five replicates that exposed wood frog tadpoles to 0 μS, we see that the mean survival is 91 percent and the sample variance is 5 percent. Using this sample variance, we can calculate the sample standard deviation as:
and we can calculate the standard error of the mean as:

Standard deviation of the mean = 7.0
Standard error of the mean = 3.1
45