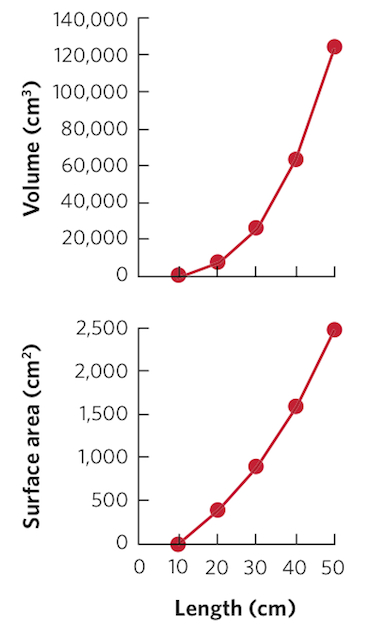
Graphing The Data: Relating Mass to Surface Area and Volume
In this chapter, we saw that surface area of an organism increases approximately as the square of the organism’s length whereas the volume increases approximately as the cube of the organism’s length. Using the following data, graph the relationship between length and surface area and the relationship between length and volume. Based on these two graphs, notice how increases in body length affect volume much more rapidly than surface area.
| LENGTH (cm) | SURFACE AREA (cm2) | VOLUME (cm3) |
|---|---|---|
| 10 | 100 | 1,000 |
| 20 | 400 | 8,000 |
| 30 | 900 | 27,000 |
| 40 | 1,600 | 64,000 |
| 50 | 2,500 | 125,000 |