There is an unequal heating of Earth by the Sun
The differences in temperature around the globe are the result of how much solar radiation strikes the surface of Earth at a given location. Differences in solar radiation are determined by the angle of the Sun striking different regions of the globe, the depth of the atmosphere that the energy passes through, and seasonal changes in the position of Earth relative to the Sun.
The Path and Angle of the Sun
Consider the position of the Sun during the March and September equinoxes when the Sun is positioned directly over the equator. At these times of the year, the equator receives the greatest amount of solar radiation and the poles receive the least. Three factors dictate this pattern: the distance that sunlight must pass through Earth’s atmosphere, the angle at which the Sun’s rays hit Earth, and the reflectivity of Earth’s surface.
As illustrated in Figure 5.2, before the rays of the Sun reach Earth, they must travel through Earth’s atmosphere. When they pass through the atmosphere, gases absorb some of the solar energy. Following the path of the rays, you can see that the distance traveled through the atmosphere is shorter at the equator than at the poles. This means that less solar energy is removed by the atmosphere before it strikes Earth at the equator.
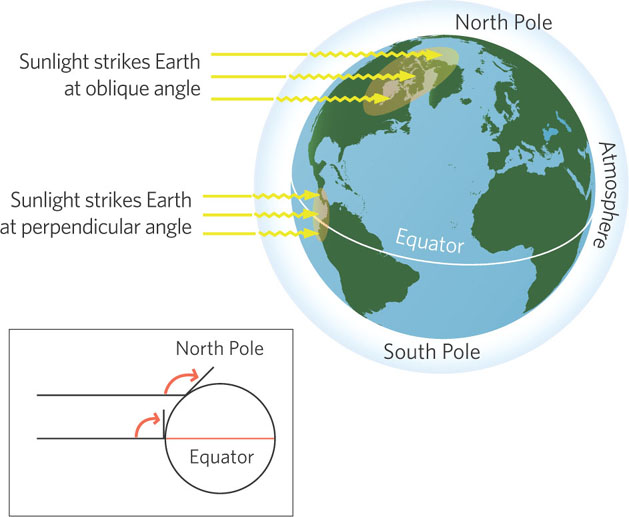
The intensity of solar radiation that strikes an area also depends on the angle of the Sun’s rays. Looking again at Figure 5.2, you can see that when the Sun is positioned directly above the equator, the rays of the Sun strike Earth at a right angle. This causes a large quantity of solar energy to strike a small area. In contrast, near the poles the rays of the Sun strike Earth at an oblique angle, which causes the solar energy to spread over a larger area. As a result, Earth’s surface receives more solar energy per square meter near the equator than near the poles. You can replicate this phenomenon by shining a flashlight onto a large ball. If you point the flashlight at the middle of the ball, you will see a small circle of intense light. However, if you then rotate the flashlight so that it points near the top or bottom of the ball, the beam of light spreads over a larger area and this light is less intense per unit area.
117
Finally, some surfaces of the globe reflect solar energy more than others. Light-colored objects reflect a higher percentage of solar energy than dark-colored objects, which absorb most incoming solar energy. For example, asphalt absorbs 90 to 95 percent of the total solar energy that strikes its surface, which explains why asphalt pavement becomes so hot on a sunny summer afternoon. On the other hand, cropland reflects 10 to 25 percent of the total solar energy that strikes its surface and fresh snow reflects 80 to 95 percent. The fraction of solar energy reflected by an object is its albedo. As you can see in Figure 5.3, the more solar energy reflected, the higher the albedo.
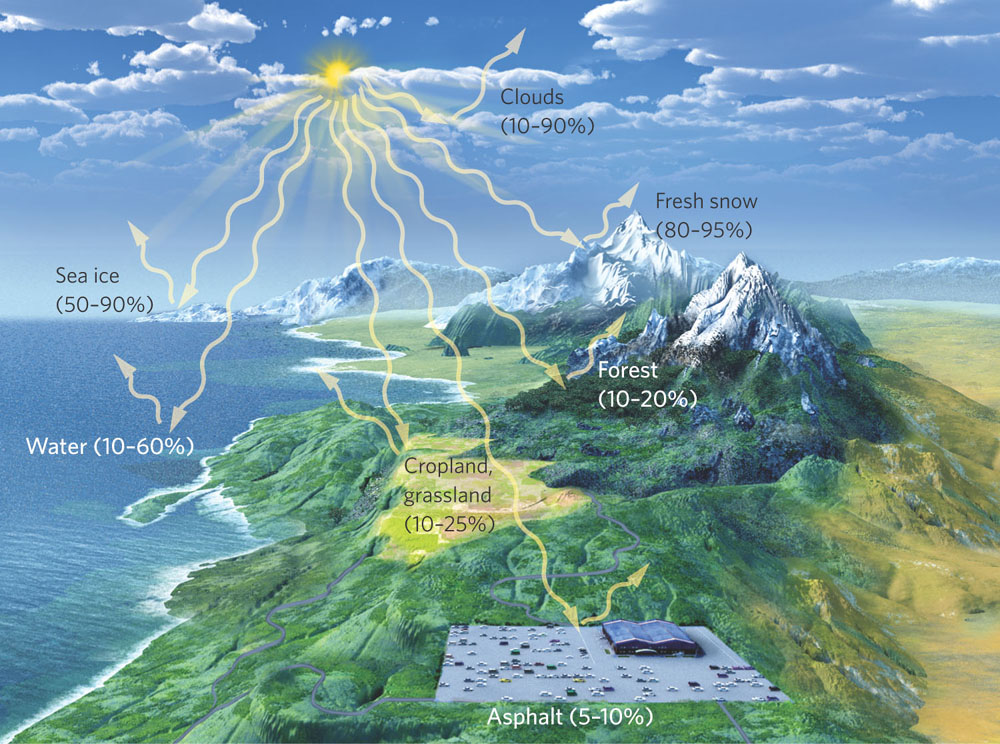
Albedo The fraction of solar energy reflected by an object.
The unequal heating of Earth explains the general pattern of declining temperatures as we move from the equator to the poles. At the equator, the Sun’s rays lose less energy to the atmosphere, solar energy is spread over a smaller area, and the low albedo of dark-colored forests causes much of this energy to be absorbed. Near the poles, however, the Sun’s rays lose much more of their energy to the atmosphere, solar energy is spread over a larger area, and the high albedo of the snow-covered land causes much of this solar energy to be reflected. This helps explain why the plant hardiness zone numbers we discussed at the beginning of this chapter generally decrease as you move to higher latitudes.
Seasonal Heating of Earth
The relationship between the Sun and Earth also causes seasonal differences in temperatures on Earth. The axis of Earth is tilted 23.5° with respect to the path Earth follows in its orbit around the Sun. Figure 5.4 illustrates how this tilt affects the seasonal heating of Earth. During the March equinox, the Sun is directly over the equator. As we approach the June solstice, the orbit and tilt of Earth causes the Sun to be directly over 23.5° N latitude, which is also known as the Tropic of Cancer. In September, the Sun is back to being directly over the equator, and in December the Sun is directly over 23.5° S latitude, which is also known as the Tropic of Capricorn.
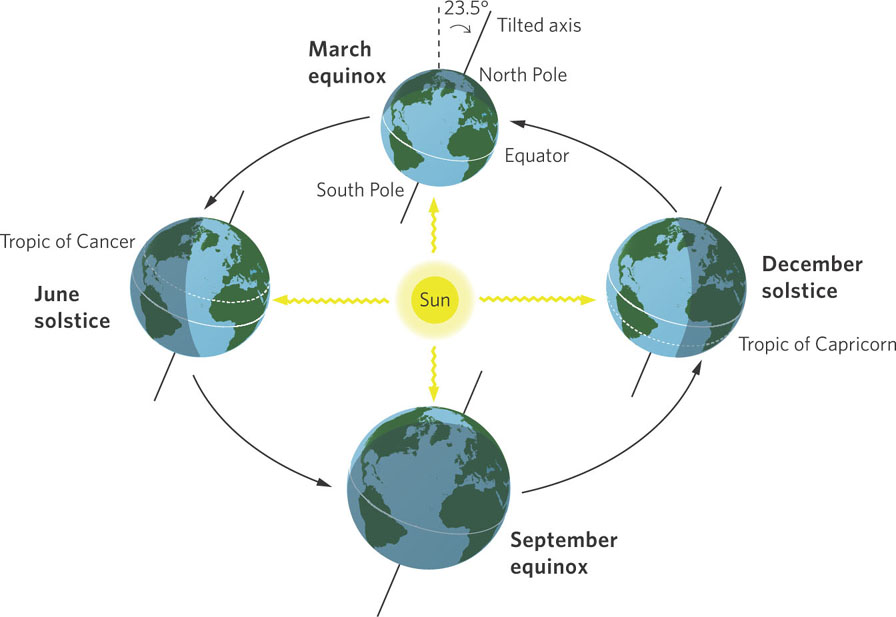
Solar equator The latitude receiving the most direct rays of the Sun.
The tilt of Earth as it orbits around the Sun causes the Northern Hemisphere to receive more solar energy between March and September than the Southern Hemisphere. During this time the daylight period in the Northern Hemisphere is greater than the nighttime period, and the Sun’s angle is 90° somewhere over the Northern Hemisphere. This means that more intense solar radiation is produced per unit area and for a longer period of time. Between the fall equinox in September and the spring equinox in March, the situation reverses and the Southern Hemisphere has longer days and receives more direct solar energy than the Northern Hemisphere. The latitude that receives the most direct rays of the Sun, known as the solar equator, shifts throughout the year—from 23.5° N latitude in June to 23.5° S latitude in December. These are the warmest latitudes on Earth and are known as the tropical latitudes.
118
ANALYZING ECOLOGY
Regressions
Regression A statistical tool that determines whether there is a relationship between two variables and that also describes the nature of that relationship.
As we have discussed, latitudes closer to the equator receive more solar radiation than latitudes closer to the poles. Given this observation, lower latitudes should also have warmer temperatures than higher latitudes. In fact, understanding the nature of this relationship would help us determine exactly how much temperature changes with latitude. When we want to know how one variable changes in relation to another, we use a statistical tool called regression. In Chapter 4 we saw that a correlation determines if there is a relationship between two variables. A regression determines whether there is a relationship and also describes the nature of that relationship.
To help illustrate this idea, we can use data on the average January temperature from 56 cities around the United States, spanning the latitudes of the contiguous 48 states. If we plot the relationship between city latitude and average city temperature in January, we obtain the following graph:
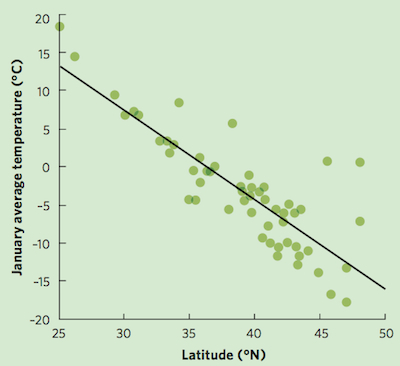
In this case, the relationship between the two variables follows a straight line; we have drawn a line of best fit through the distribution of the data points. This is a regression line because it represents the relationship between the two variables. It informs us about the nature of the relationship through the slope and intercept of the line. For these data, the regression can be described using the equation of a straight line, where Y is the dependent variable, X is the independent variable, m is the slope of the line, and b is the Y-intercept of the line at the point where X = 0. In this example, the slope is –1.2 and the intercept is 43:
Y = mX +b
Temperature = −1.2 × Latitude + 43
This regression equation tells us that for every 1 degree increase in latitude, the average temperature in January decreases by 1.2°C. Note that while the simplest form of a regression is a straight line, regression lines can also be curvilinear.
Given the equation:
Temperature = –1.2 × Latitude + 43
At a latitude of 10 degrees, the mean January temperature is
Temperature = –1.2 × 10 + 43 = 31°C
At a latitude of 20 degrees, the mean January temperature is
Temperature = –1.2 × 20 + 43 = 19°C
At a latitude of 30 degrees, the mean January temperature is
Temperature = –1.2 × 30 + 43 = 7°C
Seasonal changes in temperature vary as Earth traces its annual path around the Sun. While the average temperatures of the warmest and coldest months in the tropics differ by as little as 2°C to 3°C, at higher latitudes in the Northern Hemisphere average monthly temperatures vary by an average of 30°C over the year and extreme temperatures vary by more than 50°C annually.
119