Graphing The Data: Frequency-Dependent Selection
In most organisms with separate sexes, the proportion of males and females changes over time. Using a line graph, graph the proportion of male and female zebras in a population over a 10-year period.
Based on these data, what happens whenever one sex becomes rare or common?
| YEAR | MALES | FEMALES |
|---|---|---|
| 1 | 45% | 55% |
| 2 | 48% | 52% |
| 3 | 52% | 48% |
| 4 | 55% | 45% |
| 5 | 53% | 47% |
| 6 | 47% | 53% |
| 7 | 44% | 56% |
| 8 | 49% | 51% |
| 9 | 55% | 45% |
| 10 | 45% | 55% |
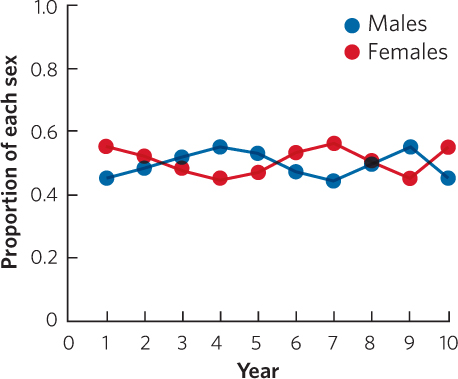
Whenever one of the sexes becomes rare, it subsequently becomes common. Over the long term, we tend toward an equal sex ratio.