4.1 Using the Scientific Method to Understand Abnormality

Perhaps your observations about depression and relationship breakups are based simply on a coincidence: People—particularly young people—are frequently beginning and ending relationships, and depression and breakups occur completely independently of each other. Many of the depressed students coming to the counseling center have had prior bouts of depression. In such cases, a breakup would not necessarily be the culprit, because those people might have had another bout of depression regardless. Alternatively, there may be a causal connection between breaking up and depression—but it could go either way, with either one leading to the other.
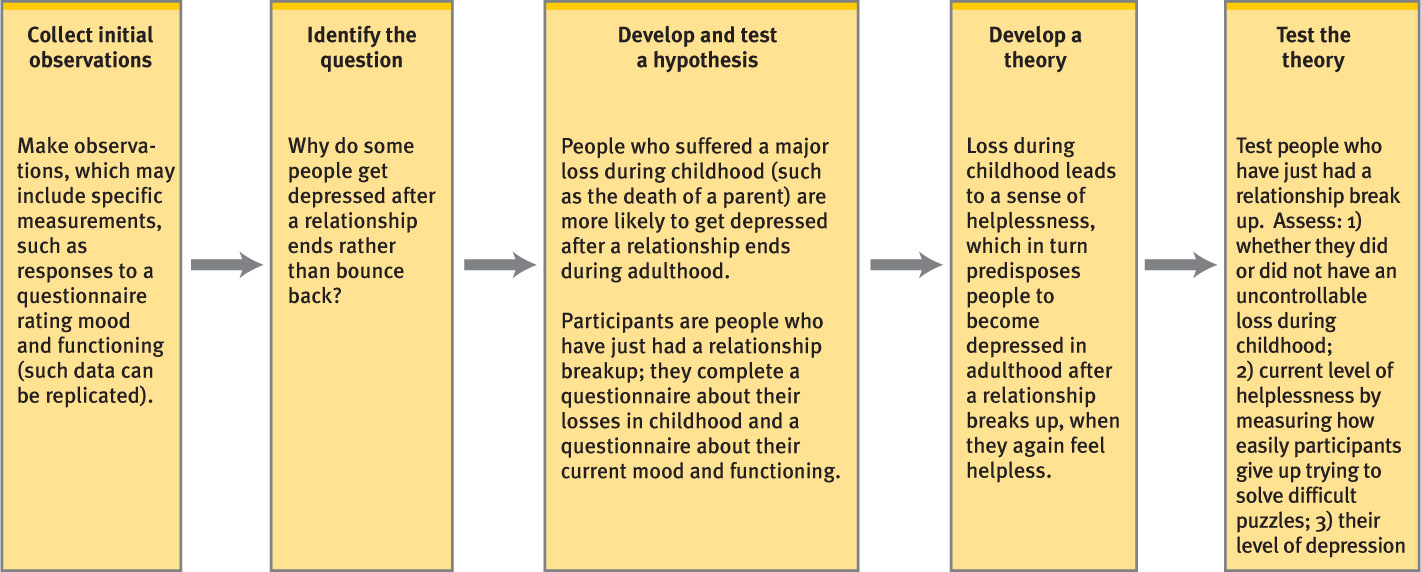
To determine whether the breaking up of a relationship can in fact lead to depression, you would use the scientific method, which is the process of gathering and interpreting facts that generally consists of the following steps:
- Collect initial observations
- Identify a question
- Develop a hypothesis that might answer the question
- Collect relevant data to test the hypothesis
- Develop a theory
- Test the theory
Scientific method The process of gathering and interpreting facts that generally consists of collecting initial observations, identifying a question, developing a hypothesis that might answer the question, collecting relevant data, developing a theory, and testing the theory.
The Scientific Method
How can the scientific method help researchers learn more about the association between breakups in relationships and depression or, more generally, about how a psychological disorder such as depression arises?
Collect Initial Observations
Data Methodical observations, which include numerical measurements of phenomena.
The first step in the scientific method is to collect initial observations. Sometimes the initial observations lead immediately to the next steps, but other times they lead the researcher to describe the phenomenon more carefully and systematically by collecting data. Data are methodical observations, which often include numerical measurements of phenomena. Scientific facts are based on such data. Data about depression and breakups, for instance, might include responses to a questionnaire on which people who have recently gone through a breakup rate their moods and functioning.
Replication The process of repeating a study using the same data collection methods under identical or nearly identical conditions to obtain data that should have the same characteristics as those from the original study.
Properly collected data can be replicated under identical or nearly identical conditions: Any other researcher, using the same collection method, should obtain a second set of data with the same characteristics as the first. For example, if a researcher at another college’s counseling center gave the same questionnaire about mood and functioning to a different group of students who’d recently suffered a breakup, that researcher would be trying to replicate the data.
Identify a Question
The process of explaining a set of observations begins by asking a specific question. Let’s say that your observations have led you to ask this question: “Why do some people get depressed after a relationship ends rather than bounce back?” The question identifies an area where properly conducted research can point toward an answer.
89
Develop and Test a Hypothesis
Hypothesis A preliminary idea that is proposed to answer a question about a set of observations.
After identifying a question, a researcher forms a hypothesis. A hypothesis is a preliminary idea that is proposed to answer the question about a set of observations. Hypotheses are important in part because they direct the researcher to make specific additional observations (which may include making precise measurements). The most common kinds of hypotheses propose a way to understand differences in measurements of a variable in different circumstances (such as differences in rates of depression when no breakup has occurred versus soon after a breakup) or to establish a relationship between different variables. Variables are measurable characteristics of the object or event of interest; for example, mood (rated on a scale ranging from very positive to very negative) is a variable. For instance, a hypothesis might address which people are likely to get depressed or why some people are likely to get depressed. Let’s say you develop this hypothesis: People who suffered a major loss during childhood (such as the death of a parent) are more likely to get depressed after a relationship ends during adulthood. Your hypothesis involves two variables: (the presence or absence of) childhood loss and depression.

After the researcher has a hypothesis, he or she must test it by collecting new data. If the resulting data are as expected, the hypothesis is supported. But if the data are inconsistent with the hypothesis, the researcher must think again—and try to develop a new hypothesis and then test it. And even when the data generally are consistent with the hypothesis, often some aspect of the data were unexpected, which leads to new hypotheses to be tested.
Develop a Theory
Theory A principle or set of principles that explains a set of data.
After enough data are collected and hypotheses are confirmed or disconfirmed, the researcher proposes a theory, which is a principle or set of principles that explains a set of data. A theory provides an answer to the question identified by the researcher. For example, you might theorize that depression is particularly likely to arise in adults after a relationship ends if they, as children, suffered a loss and there was nothing they could do to control or manage the situation. That is, according to this theory, the child forms an enduring association between loss and a sense of helplessness, and it is the feelings of helplessness that produce depression. According to this theory, when later in life the adult experiences a loss, this triggers the associations to helplessness, which in turn leads the adult to become depressed.
Test the Theory
Predictions Hypotheses that should be confirmed if a theory is correct.
The next step of the scientific method is to test the theory by collecting and examining additional data. The theory leads to predictions, hypotheses that should be confirmed if a theory is correct. So, for instance, your theory focuses on people who not only had a significant loss during childhood but also felt that they could not control or manage the situation. The theory predicts that children who felt particularly helpless after a loss would be more likely as adults to become depressed after a relationship breaks up. Data can then be collected to address this specific prediction: In addition to questionnaires about early loss and mood and functioning, an additional questionnaire might ask about memories of feeling helpless. You could then test people who did or did not have an uncontrollable loss during childhood by giving them increasingly difficult puzzles; as a measure of current feelings of helplessness, you would assess how easily participants give up trying to solve the puzzles. You would predict that people who experienced a loss as a child would be more likely to feel—and behave as if they were—helpless currently, and that these people would become depressed after a relationship breaks up. Many methods can be used to test the predictions made by a theory, and we’ll see what these are in the following section.
Figure 4.1 provides a summary of the steps of the scientific method.
90
Types of Scientific Research
Any individual researcher does not need to go through the entire sequence of steps in the scientific method to be doing science. Moreover, psychologists may employ different research methods when they work on different phases of the sequence and when they attempt to answer different questions; such methods include experiments, quasi-experiments, correlational research, case studies, and meta-analysis. As we review the various research methods, we will point out both their major strengths and their weaknesses.
Conducting Research with Experiments
Experiments Research studies in which investigators intentionally manipulate one variable at a time, and measure the consequences of such manipulation on one or more other variables.
Ideally, researchers prefer to employ experiments, which are research studies in which investigators intentionally manipulate one variable at a time and measure the consequences of such manipulation on one or more other variables.
Independent Variables and Dependent Variables
Independent variable A variable that a researcher manipulates.
You probably noticed that the definition of experiments mentioned two kinds of variables: those that are manipulated and those that then are measured. In an experiment, researchers manipulate one variable at a time in order to observe possible changes in another variable. The variable that a researcher manipulates is called the independent variable (so named because it is free to change—it is independent). The variable that may change as a result is called the dependent variable (because its value depends on the independent variable). When the independent variable is changed, the accompanying changes in the dependent variable are the effect. A researcher might separately manipulate several independent variables (always keeping all else constant while a single variable is changed), hoping to discover which ones cause the greatest effect on the dependent variable.
Dependent variable A variable that is measured and that may change its values as a result of manipulating the independent variable.
Of course, researchers could not use an experimental design to investigate the specific question about helplessness during early loss and subsequent depression after a breakup. A researcher ethically cannot cause a person to have a major loss during childhood (or to feel helpless at the time). Participants in an experimental study come as they are—with particular neurological, psychological, and social histories that can’t be changed.
This is why most of the research on causes of psychological disorders does not use an experimental design. For ethical reasons as well as practical ones, researchers cannot alter participants’ genes, subject participants to high levels of stress, cause them to have traumatic experiences, or create disruptive family events—all of which would involve intentionally manipulating independent variables. However, some aspects of psychopathology can be studied with an experimental design. For instance, Watson and Rayner’s experiment with Little Albert (1920; see Chapter 2) used an experimental design to test a theory about the etiology of a phobia. In that study, the independent variable was whether or not the conditioned (that is, the initially neutral) stimulus had been paired with an aversive unconditioned stimulus. The dependent variable was the presence of fear-related behaviors—as measured by Albert’s crying and trying to get away from the white rat. When the conditioned stimulus (CS) and the unconditioned stimulus (UCS) had not yet been paired, Albert was not afraid of the rodent. His fear-related behaviors (the dependent variable) depended on his exposure to the pairing of CS and UCS. (Note that the ethical guidelines that apply to research today had not yet been developed at the time of Watson and Rayner’s study with Little Albert.)
91
Other examples of experimental designs in research on psychopathology include studies of people who have panic attacks—specific periods of intense dread or fear, accompanied by physical symptoms of fear; the independent variable is the situation or condition that may induce a panic attack (which is manipulated by presenting or removing such a situation or condition), and the dependent variable is the number of such attacks. Further examples include studies of people who have substance abuse problems, where the independent variable is the type of cues, or stimuli, that trigger cravings to take a drug or to drink alcohol, and the dependent variable may be intensity of cravings for the drug or alcohol or physiological measures of arousal.

Confounding variables Factors that might inadvertently affect the variables of interest in an experiment.
If an experiment has not been carefully designed, some factors might inadvertently affect the variables of interest. These factors are called confounding variables, also referred to as confounds. For example, suppose that you conducted an experiment in which the independent variable was the type of movie viewed by two groups of participants, those who had experienced a loss during childhood and those who did not. One movie involved the death of a loved one and the other did not touch on the theme of loss, and the dependent variable was mood. Then suppose that for the “loss” group, the movie involving loss was always shown immediately after a serious drama, whereas for the “no loss” group, the movie that did not involve loss was always shown immediately after a comedy. It could be the type of movie shown first—drama or comedy—and not differences between the groups that produces the effects on the dependent variable; thus, the type of film first shown is a confounding variable. Confounds lead to ambiguous or uncertain results. To minimize the possibility of confounds, a researcher should try to ensure that the experimental manipulation alters only the independent variables (and does not inadvertently affect other variables, such as the order in which the movies are presented) and that only those changes in the independent variables affect the dependent variable.
Control Groups and Control Conditions
Control group A group of participants in an experiment for which the independent variable is not manipulated, but which is otherwise treated identically to the experimental group.
A common method for ruling out possible effects of confounds in an experiment is to create a control group. The experimental group (or groups) and the control group are treated identically throughout the experiment, except that the independent variable is not manipulated for the control group. For example, say that the participants who had suffered an early loss and experienced helplessness did in fact have a more negative mood after watching a movie with the theme of loss. But here’s a potential confound: Maybe these people are just very sensitive to depressing movies in general, not to themes of loss specifically. To rule out this possibility, you would control for this factor by testing another group of these people, showing them a depressing movie that has nothing to do with loss. (This movie should be as similar as possible to the first one in every way, except that it does not have the theme of loss.) If the finding does not result from a confounding, then you should find a much larger drop in mood following the movie about loss than following the movie that was merely depressing—which would provide evidence that the theme of loss itself is important.
92
To use a control group appropriately, it must be as similar as possible to the experimental group. If the members of a control group differ from members of the experimental group in terms of age, education, cultural background, temperament, or any other characteristic, one or more confounding variables has been introduced. Such a confound would cloud the interpretation of the results because a difference in the dependent variable could be attributed to the confound instead of to the relationship you intended to test. Perhaps the control group responded less strongly to the depressing movie simply because most of the participants in that group happened to be temperamentally placid.
You can imagine how hard it can be to match a control group perfectly to an experimental group. This difficulty often leads researchers to match the experimental group to the most similar possible control group: the experimental group itself! Sometimes, rather than having two separate groups that are treated differently, researchers have all participants take part in different conditions, or circumstances, which correspond to the different ways that experimental and control groups would be treated in a study that had both types of groups. For example, the same people could watch a movie about loss and at a different time watch a movie that is depressing but not about loss. However, when the same group of people take part in more than one condition, you need to avoid a confound introduced by the order of presentation of the conditions. For instance, if the “loss” film was always presented first, it could be that the participants were more alert during that part of the study and that’s why they responded differently. To avoid this, you would counterbalance the order of exposure to each condition: Half of the participants would watch the “loss” film first, and the other half would watch the “nonloss/depressing” film first. This procedure would ensure that each condition occurred equally often in each place in the order of presentation.
Possible Effects of Bias
Bias A tendency that distorts data.
The way a study is set up can affect the assignment of participants into groups or can inappropriately influence the outcome of the experiment. For instance, suppose that you have two groups: Members of one group see a “loss-and-depressing” film, and members of the other see a “nonloss-but-depressing” film. When you assign participants to the groups, you inadvertently assign the people who smile at you to the “non-loss-but-depressing” group. Whether or not it is conscious (intentional) or unconscious (unintentional), a tendency or influence that distorts data—which ends up producing a confound—is called bias. This is why researchers place participants in groups using random assignment, assigning participants to each group by a procedure that relies on chance.
Random assignment Assigning participants to each group in a study using a procedure that relies on chance.
Sampling bias The distortion that occurs when the participants in an experiment have not been drawn randomly from the relevant population under investigation.
Many sorts of biases exist. For example, a particularly important one is sampling bias, which occurs when the participants are not drawn randomly from the relevant population. Sampling bias needs to be avoided if you want to be able to generalize (i.e., extrapolate) from the people in your study to the population at large. This brings us to an important distinction: The population is the complete set of possible participants (e.g., all rats or all people, or, in certain cases, all people of a particular age, gender, or race). The sample is the small portion of the population that is examined in a study.
Population The complete set of possible relevant participants.
Sample The small portion of a population that is examined in a study.
Internal and External Validity
Internal validity A characteristic of a study that indicates that it measures what it purports to measure because it has controlled for confounds.
A study has internal validity if it controls for possible confounding variables. Internal validity means that variations in the independent variable are in fact responsible for variations in the dependent variable (or variables, in studies in which more than one type of measurement is taken) and that the results are not a by-product of other, extraneous variables.
93
External Validity A characteristic of a study that indicates that the results generalize from the sample to the population from which it was drawn and from the conditions used in the study to relevant conditions outside the study.
A study is said to have external validity when (1) the results generalize from the sample (the particular participants who were tested) to the population from which it was drawn and (2) the conditions used in the study (such as the particular movies shown) generalize to similar conditions outside the study. If a study does not have internal validity, it cannot have external validity. In contrast, even if a study has internal validity (its results are not produced by confounds), it is not guaranteed to have external validity (that its results apply to other people and other similar situations).

Quasi-Experimental Design
Ideally, the participants in a study are randomly assigned to groups. But in many cases, random assignment is not ethical, desirable, or possible. For instance, when trying to test hypotheses about why a disorder develops, researchers cannot “assign” one group to have a particular set of genes or brain functioning, a particular way of thinking, a particular type of traumatic experience, or particular friends or families. Therefore, in trying to understand possible causes of psychopathology, researchers often use quasi-experimental designs, which rely on groups that already exist. In fact, the “experiment” that we have been discussing is—like much research on psychopathology—a quasi-experiment: As in an experiment, an independent variable was manipulated and a dependent variable was measured, but participants were selected from preexisting groups, not randomly assigned.
To have made a true experiment, you would need to have assigned participants randomly to three groups (loss with helplessness, loss without helplessness, and no loss) during childhood. Obviously, this is undesirable and impossible. But in a quasi-experimental design, you can sort participants into groups—those who had a childhood loss and experienced helplessness, those who had a childhood loss but didn’t experience helplessness, and those without a childhood loss. Then you might show people in all three groups a film that involves relationships breaking up. After viewing the film, participants in all three groups would rate their mood. Your hypothesis would be that participants who experienced early loss and helplessness (like Carlos) will report greater sadness after seeing the film than will those in the other two groups. With a quasi-experimental design, you still try to control as many variables—such as age, health, education, and economic level—as you can in order to make the groups as similar as possible.
Correlational Research
Correlation The relationship between the measurements of two variables in which a change in the value of one variable is associated with a change in the value of the other variable.
Experiments and quasi-experiments allow researchers to zero in on which variables cause which effects. In some cases, however, manipulating variables, even in a quasi-experiment, can be unethical or difficult. When independent variables can’t or shouldn’t be manipulated, researchers can study the relationships among variables by looking for a correlation, a relationship between the measurements of two variables in which a change in the value of one variable is associated with a change in the value of the other variable. Much of the research on defining and understanding psychopathology is correlational.
94
A correlation compares two measurements and indicates the amount of similarity in their variations; the stronger the correlation, the more closely related the two variables are. There are no independent and dependent variables in correlational research: Nothing is manipulated; instead, naturally occurring variations among measurements of different variables are compared. These comparisons can involve measures from different individuals or groups, or measures from the same participants at different times. For example, if your study were correlational, your two variables of interest might be the extent to which a child experienced helplessness during a loss (perhaps rated by relatives who were present at the time or by the person’s memory of how severe the feeling of helplessness was) and the number of symptoms of depression experienced as an adult, after a breakup. Twin studies (discussed in Chapter 2) often involve correlational research.

Correlation Does Not Imply Causation
A major disadvantage of correlational methods is that they only indicate that two variables are related. A correlation between variables does not demonstrate causation—that is, it does not mean that either variable caused the other to change. In an experiment or in a quasi-experiment, the point is to show that changes in the independent variable cause changes in the dependent variable. In contrast, in a correlational research study, the point is only to show that the values of two variables are related. For example, although the degree of helplessness felt during childhood loss and the amount of depression after an adult relationship breaks up may be correlated, the loss experienced after the breakup may not be the cause of the depression. As discussed earlier, it could be that depression comes first, and it causes the breakup! Simple correlations do not control for possible confounding variables.
Measuring a Correlation
correlation coefficient A number that quantifies the strength of the correlation between two variables; the correlation coefficient is most typically symbolized by r.
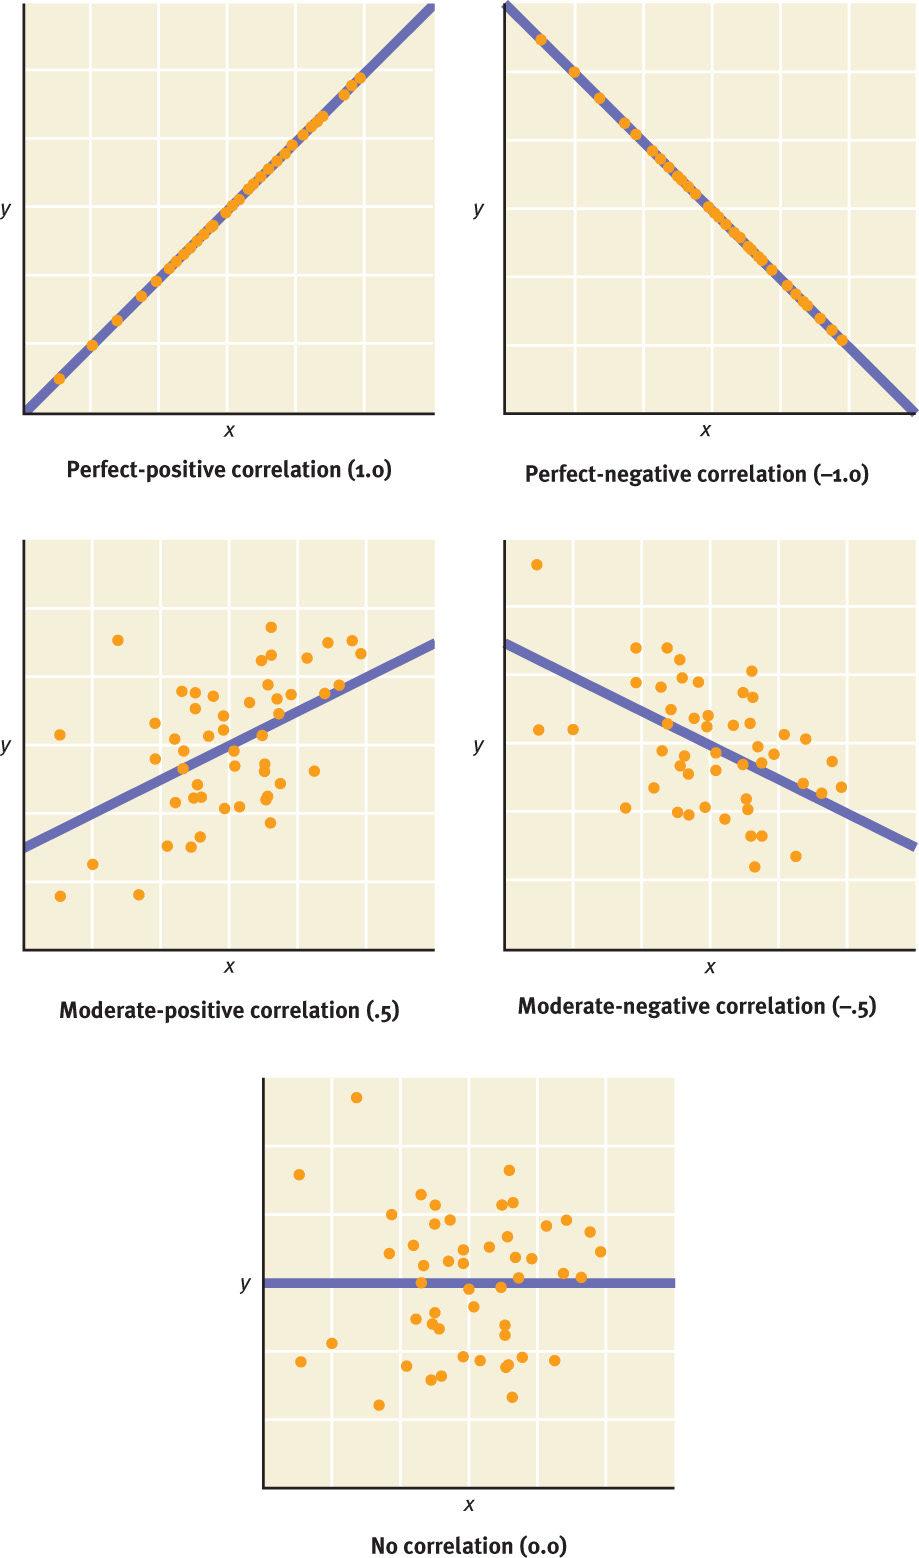
The strength of the correlation between any two variables is quantified by a number called a correlation coefficient (most typically symbolized by r). When this number is positive, it signifies that the variables change in the same direction; both variables either increase or decrease in the same general pattern. A positive relationship is indicated by any correlation coefficient between 0 and +1. When the correlation coefficient is negative, it signifies that the variables change in opposite directions in the same general pattern; one goes up while the other goes down. A negative relationship is indicated by a correlation coefficient between 0 and −1. In either case, positive or negative, the stronger the relationship, the closer the coefficient is to +1 or −1, which would indicate a perfect correspondence.
If the variables do not have any relationship at all, the correlation coefficient is 0. If you plot two variables on a graph, putting one variable on each axis, you can see whether or not the variables change together. The closer the data points are to a straight line that has a slope (either up, for positive correlations, or down for negative ones), the stronger the correlation. Figure 4.2 illustrates five correlations.
Statistical Significance
Statistically significant The condition in which the value of a statistical test is greater than what would be expected by chance alone.
Even when variables are completely independent, they might vary in the same pattern simply by chance. In fact, the correlation coefficient between any two randomly selected sets of data is very seldom exactly 0. A correlation coefficient—or the result of performing any other statistical test (such as a “t-test,” which assesses the difference between means)—is statistically significant when it is greater than what would be expected by chance alone. Statistical significance is not the same thing as “importance.” It simply means that the observed result is unlikely to be a quirk of random variation in the data. Suppose that, for your participants, you calculated the correlation between age when experiencing a loss during childhood and symptoms of depression after an adult breakup, and the result was r = −0.31. This means the younger a person was when a loss occurred, the more symptoms of depression he or she is likely to have after a breakup as an adult. However, this relationship may not hold for every participant. Researchers want to know not only the correlation coefficient but also the value of p (which stands for probability) that is associated with that coefficient; the value of p indicates how likely it is that the correlation could have arisen due to chance. For instance, your correlation coefficient of −0.31 was tied to p < .01. This means that the probability that the correlation is due to chance is less than 1 in 100. Similarly, a value of p < .05 means that the probability that the correlation is due to chance is less than 5 in 100. In fact, p < .05 is usually considered the cutoff for statistical significance. As a rule, the more participants that were tested, the lower the correlation can be and be statistically significant.
95
Using Correlational Methods
Epidemiology The type of correlational research that investigates the rate of occurrence, the possible causes and risk factors, and the course of diseases or disorders.
Correlational research in psychopathology is designed to discover whether one variable (which often taps a characteristic of a disorder) is linked to other variables (which often tap a symptom or associated factor, such as alterations in neural activity, irrational thoughts, or family functioning). Epidemiology is a type of correlational research that investigates the rate of occurrence, the possible causes and risk factors, and the course of diseases or disorders. Thus, in epidemiological studies of psychopathology, researchers identify people with one (or more) disorder and correlate the presence or severity of the disorder with other variables, such as the age of onset of the disorder, the number of people in the family who have had symptoms of the disorder, or socioeconomic status.
Longitudinal studies (in studies of psychopathology) Research studies that are designed to determine whether a given variable is a risk factor by using data collected from the same participants at various points in time.
Note that certain factors (such as having a relative with a disorder) can be risk factors, which increase the likelihood of developing a disorder. However, by definition, risk factors are simply that—risks, not destiny. How are such risks identified? Studies often use correlational data to determine whether people who have a psychological disorder are different in some way from people who don’t have the disorder. Some of these studies are longitudinal studies, which are designed to determine whether a given variable is a risk factor by using data collected from the same participants at multiple points in time. Specifically, such studies track a group of children or adults over time and observe whether a disorder develops. The presence or absence of the disorder (or its level of severity) is then correlated with neurological factors (perhaps information about brain structure or function or hormone levels), psychological factors (cognitive or emotional functioning, beliefs, or personality traits), and/or social factors (family and other intimate relations, school performance, or socioeconomic status) that typically were assessed at an earlier point in time. Factors that are significantly correlated with the subsequent emergence of the disorder are taken to signal risk for developing that disorder. However, because such longitudinal studies are usually correlational, researchers cannot infer causality on the basis of the findings. As with virtually all correlational studies, many factors can explain differences observed in longitudinal studies.
96

Case Studies
Case studies (in studies of psychopathology) A research method that focuses in detail on one individual and the factors that underlie that person’s psychological disorder or disorders.
Research on psychopathology may also rely on case studies, which focus in detail on one person and the factors that underlie his or her psychological disorder or disorders. For instance, someone noticed that a young patient had a very bad sore throat prior to developing symptoms of obsessive-compulsive disorder (OCD)—a disorder that is characterized by frequent and intrusive unwanted thoughts and behaviors that the individual feels compelled to engage in (we will say more about this in Chapter 7). Studies that were inspired by this observation found that OCD may sometimes develop from a particular type of streptococcal infection (Swedo et al., 1998), and eventually researchers identified pediatric autoimmune neuropsychiatric disorder associated with streptococcal infection, or PANDAS (Giulino et al., 2002). PANDAS appears to arise, at least in part, when antibodies that attack the strep bacteria also attack a part of the brain known as the basal ganglia. Antibiotics that treat the strep infection (leading to lower levels of antibodies) end up decreasing the OCD symptoms. The discovery of PANDAS began from a case study. Case 4.1 discusses a case of a young woman with autism spectrum disorder—a disorder that is diagnosed in childhood and involves significant problems with communication and social interactions. (We’ll discuss this disorder in more detail in Chapter 14.)
CASE 4.1 • FROM THE OUTSIDE: Menstruation-Related Exacerbation of Autism Symptoms
A 19-year-old nonverbal girl [with autism spectrum disorder and severe intellectual disability (previously called mental retardation)] was referred for treatment of aggression and SIB [self-injurious behavior]. At onset of menarche at age 12, agitation dramatically increased. Her mother recorded cyclical behavioral changes along with her menses. Before each menses, she became withdrawn, apathetic, quiet, irritable, and easily agitated with increased tantrums and appeared anxious. She also had a cyclical amplification of baseline autistic behaviors: stereotypies (rocking), sensitivity to changes, and sensitivity to noise. New-onset cyclical handbiting was so intense that scarring resulted, and cyclical aggression directed at objects and others occurred several times daily. Teacher reports recorded and corroborated aggression and SIB that corresponded to the days before the onset of her menstrual period. Within 1 day of menstrual onset, mood symptoms and SIB abated. Neither behavioral therapy with positive or negative reinforcement nor treatment with acetaminophen or ibuprofen yielded improvement. Treatment with paroxetine [Paxil, an SSRI medication] 20 mg every morning resulted in improvement of premenstrual mood symptoms and premenstrual exacerbated SIB. On discontinuation of paroxetine on two distinct occasions, cyclical mood symptoms, aggression, and SIB returned.
(Lee, 2004, p. 1193)
97
Uses and Limits of Case Studies
A case study focuses on a particular individual in detail, often describing neurological, psychological, and social factors: Such a study often provides information about a person’s medical and family history, as well as his or her culture and the context of the problem. Mental health professionals use case studies for a variety of reasons:
- to demonstrate some aspect of diagnosis, etiology, or treatment;
- to provide support for (or evidence against) a particular hypothesis or theory; and
- to train other mental health professionals, who are given case studies and must then propose diagnoses and appropriate treatments.
Mental health clinicians and researchers must resist the temptation to generalize from a single case: Don’t assume that the findings from a case study necessarily can be extended to other similar cases, let alone to the population at large. Sometimes the findings can be generalized, but sometimes they cannot be; every individual is unique, and a person’s particular history presents many possible confounding factors. In addition, if a case study relies on correlations among variables, this method—as usual—prevents us from drawing conclusions about causality.
Single-Participant Experiments
Single-participant experiments Experiments with only a single participant.
Case studies are not necessarily limited to describing the values of variables and relations among them. In some situations, clinicians and researchers can actually perform experiments with only a single case. For instance, a researcher could treat someone suspected of having PANDAS-related OCD with antibiotics and determine whether the OCD symptoms improved. Experiments with only a single case are called single-participant experiments.
Single-participant experiments may rely on an ABAB design, which is often used to measure change in target behaviors as a result of some treatment. In many cases, a single participant receives both conditions: a baseline condition with no treatment (the first phase A of the ABAB design) and the treatment (phase B of the ABAB design) (Drotar, 2006). The data for the target behavior in the baseline phase (A) are compared to the data for that behavior in the next phase (B). In the second A phase, the treatment in phase B is withdrawn, and researchers can determine whether, or how quickly, the person’s targeted behavior returns to baseline (for example, withdrawing behavior modification treatment and observing what happens with extinction). This second A phase addresses the question “Will any behavior change from the previous phase persist once treatment is withdrawn?” The treatment is then presented again in the second B phase, which essentially should obtain an effect related to the effect the first time the treatment was presented.
Like case studies, single-participant experiments consider only one individual, so the results can be specific to that individual and based on neurological, psychological, or social factors that may not apply to others, or at least not in the same combination. When researchers publish the results of single-participant experiments, they often wish to inform clinicians about possible interventions that might work for patients with the same problem and in similar circumstances.
Meta-Analysis
Meta-analysis A research method that statistically combines the results of a number of studies that address the same question to determine the overall effect.
Despite the best efforts of researchers to minimize confounds, the results of any one study must be taken with a grain of salt; it’s not clear whether researchers would obtain comparable results if the study were undertaken in somewhat different circumstances. Moreover, if a study’s results are not statistically significant, it may simply indicate that not enough participants were tested. Meta-analysis is a research method that statistically combines the results of a number of studies that address the same question. This strategy can be especially valuable when some studies show an effect but others do not (Rosenthal, 1991). Because a meta-analysis increases the size of the overall data set, it can help to determine whether or not certain variables are related; a meta-analysis can uncover a relationship that is not apparent in any single study, which considers only a single sample from a particular population. In many cases, when studies are considered together in a single meta-analysis, the effect emerges loud and clear. However, a meta-analysis is only as good as the quality of the studies that go into it; if studies are poorly designed or conducted, the conclusions from a meta-analysis of them will be shaky. TABLE 4.1 provides a summary of the different research methods we’ve discussed.
| Research method | Important feature(s) | Drawback(s) |
|---|---|---|
| Experimental design | Use of independent and dependent variables and random assignment allows researchers to infer cause and effect | Most etiological factors that contribute to psychopathology cannot be studied with experiments (but experiments are often used to study the effects of treatment). |
| Quasi-experiments | Used when it is possible to identify independent and dependent variables, but random assignment of participants to groups is not possible; researchers can still infer cause and effect | Because random assignment isn’t possible, possible confounds are difficult to eliminate. |
| Correlational research | Used when it is not possible to manipulate independent variables such as etiological factors; researchers can examine relationships between variables | Results indicate only related factors, not causal factors. |
| Case studies | Often descriptive, but can use various research methods applied to a single participant | Caution must be exercised in generalizing from the sole participant to others; there are many possible confounding factors. |
| Single-participant experiments | An experiment with one participant (and so random assignment isn’t possible); cause and effect can be inferred | Caution must be exercised in generalizing from the sole participant to others; there are many possible confounding factors. |
| Meta-analysis | A statistical analysis that combines the results of a number of studies that examine the same general question to determine the overall effect | It is difficult to estimate the number of studies that failed to find an effect and thus were not published and not included in the analysis; the studies analyzed are often not of equal quality but their results are nevertheless weighted equally in the analysis. |
98
Ethical Guidelines for Research
We’ve mentioned several times that it would not be ethical to conduct certain kinds of experiments, but how do researchers decide which research studies are ethical and which are not? To address this question, psychologists have developed ethical guidelines for research, which are part of the overall ethical code for psychologists. For instance, before someone participates in a study, the investigator must provide information describing the study, as outlined in TABLE 4.2. If a person decides to participate after reading the information, he or she signs an informed consent form. By signing, the person acknowledges that he or she understands what is involved in the study and agrees to participate, knowing that he or she can withdraw from the study at any point (American Psychological Association, 2002).
When obtaining informed consent from participants, a researcher must give participants the following information:
|
| Source: Copyright © American Psychological Association. For more information, see the Permissions section. |
99
GETTING THE PICTURE

Answer: The photo on right: Offering the participant an alcoholic drink rather than soft drink needlessly increases the likelihood that the participant would relapse and creates too great a risk of harm.
AP Photo/Charles Rex Arbogast
Another ethical guideline for research is that investigators must debrief participants after a study is over. They must ask each participant about his or her experience, particularly about any negative aspects of the experience (in part so that the study can be adjusted to minimize possible negative experiences for future participants). Investigators must also clear up any misconceptions that the participant may have about the study (American Psychological Association, 2002).
In addition, agencies that fund research on psychopathology and treatment require that the study be reviewed and approved by an institutional review board (IRB) in the setting that hosts the study (e.g., hospital, university, or clinic). The IRB is composed of scientists, clinicians, and members of the community at large. The board evaluates each study’s possible risks and benefits, and then decides whether the study should be approved. This serves as another check on any ethical issues that might arise while a study is being conducted or afterward.
Thinking Like A Clinician
Dr. Xavier treats people with compulsive gambling; she also conducts research on people with this disorder. Based on her experience, she believes that people who begin gambling compulsively in their teens and early 20s have a different type of problem than those who begin gambling compulsively in their 40s or later. What type of research design would you suggest she use (experimental, quasi-experimental, or correlational) to evaluate her hypothesis, and why? What might be some confounding variables she should try to control? What types of information would you want to know before generalizing from her results to other people with compulsive gambling?.
100