DESCRIPTIVE STATISTICS
In science it is not enough to simply collect data and graph it in order to draw conclusions. Suppose we see a difference between data collected for different groups. How different must the data sets be in order to conclude that the groups are different from each other? And how can we determine whether the treatment we applied—say, growing plants with a new fertilizer—really affected growth? We turn to statistical analysis.
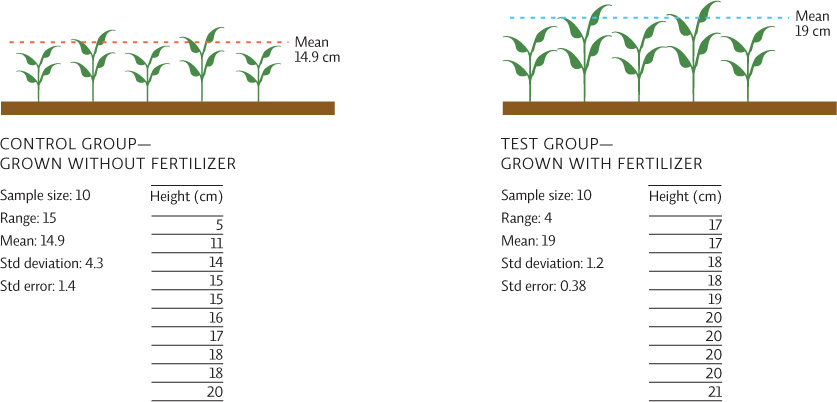
Let’s look at an example. We are growing two sets of plants, identical in every way except that one is grown without any fertilizer (the control group) and the other is grown with fertilizer (the test group). To draw conclusions, examine the values in the data table.
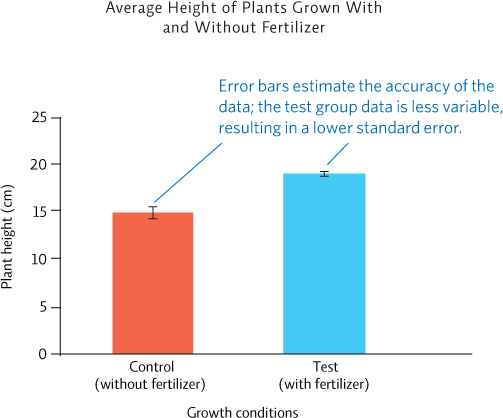
We begin with descriptive statistics—what are the characteristics of our data set? We calculate useful statistical values for each data set such as the mean (the average), the range (the highest value minus the lowest value), and the sample size (the number of subjects in each group). We might also calculate other values (with the help of any number of readily available online or calculator-based programs) that help describe the data set, such as standard deviation (the average amount of variation of each data value from the mean) and standard error (a measure that gives us an idea of how accurate our calculated mean really is, based on the standard deviation). Standard error bars are often shown with data as ± values (for example, 14.9 ± 1.4) or as error bars on a graph.
A-11