Different types of studies amass a body of evidence.
Solomon’s hypothesis generated the prediction that the stratosphere would contain high levels of chlorine monoxide, or ClO. If polar clouds and sunlight were causing chlorine to react with ozone, then the atmosphere should contain many molecules of chlorine bound to individual oxygen atoms. This prediction was falsifiable, since Solomon might not find high levels of ClO.
On both of her trips to the Antarctic, her team raised balloons into the air to measure the composition of the atmosphere where the ozone hole was found. They came back with measurements of ClO that would turn out to be their so-called smoking gun.
At the time, NASA ozone modeler Paul Newman believed that the loss of ozone in the Antarctic spring was due to excess solar activity. But when the ClO measurements from Solomon’s team streamed out of a fax machine in NASA’s Goddard Research Center, he knew the evidence supported Solomon’s polar cloud hypothesis. INFOGRAPHIC 2.5
THE CHEMISTRY OF OZONE FORMATION AND BREAKDOWN
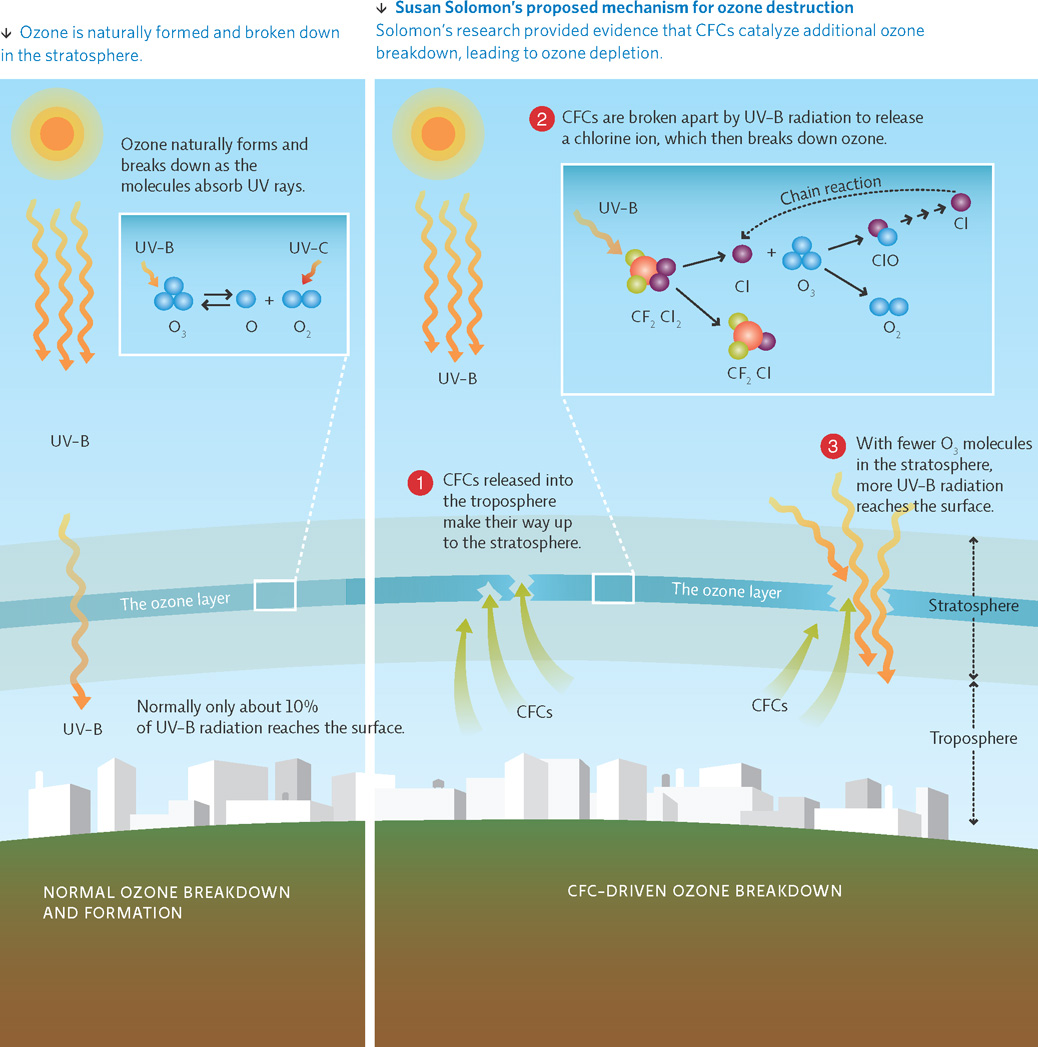

Based on Solomon’s proposed mechanism, which molecule or atom would you look for in the atmosphere to determine whether CFCs were contributing to ozone depletion: CIO, O2, CF2CI or CI? Explain why this, and only this, molecule or atom would identify CFCs as the culprit.
Only ClO would identify CFCs as the cause of ozone depletion because the only way to get ClO in the atmosphere is if UV light splits the CFC and then goes on to split ozone. O2 is already present in the atmosphere so we will find it even if CFCs are not split. Cl and CF2Cl could be formed if CFCs were split but they may not interact with ozone so their presence tells us nothing about ozone destruction. We have to look at a product of the ozone CFC reaction and that is ClO.
31
32
Solomon’s experiment is an example of an observational study, which involves collecting data in the real world without intentionally manipulating the subject of study. In these types of studies, researchers may simply be gathering data to learn about a system or phenomenon, or they may be comparing different groups or conditions found in nature. Often, researchers can conduct observational studies that take advantage of natural changes in the environment, such as collecting “before and after” data in an area to examine the effect of a natural perturbation such as a flood or volcanic eruption or, in this case, comparing areas with different levels of ozone depletion. These types of opportunities represent valuable “natural experiments” that can allow us to test cause-and-effect hypotheses, just as a controlled experimental study, in which the researcher intentionally manipulates the conditions of the experiment in a lab or field setting, allows us to do.
observational study
Research that gathers data in a real-world setting without intentionally manipulating any variable.
experimental study
Research that manipulates a variable in a test group and compares the response to that of a control group that was not exposed to the same variable.
33
KEY CONCEPT 2.6
Both observational and experimental studies are needed to help us make sense of the natural world. Each supplies different lines of evidence for analysis.
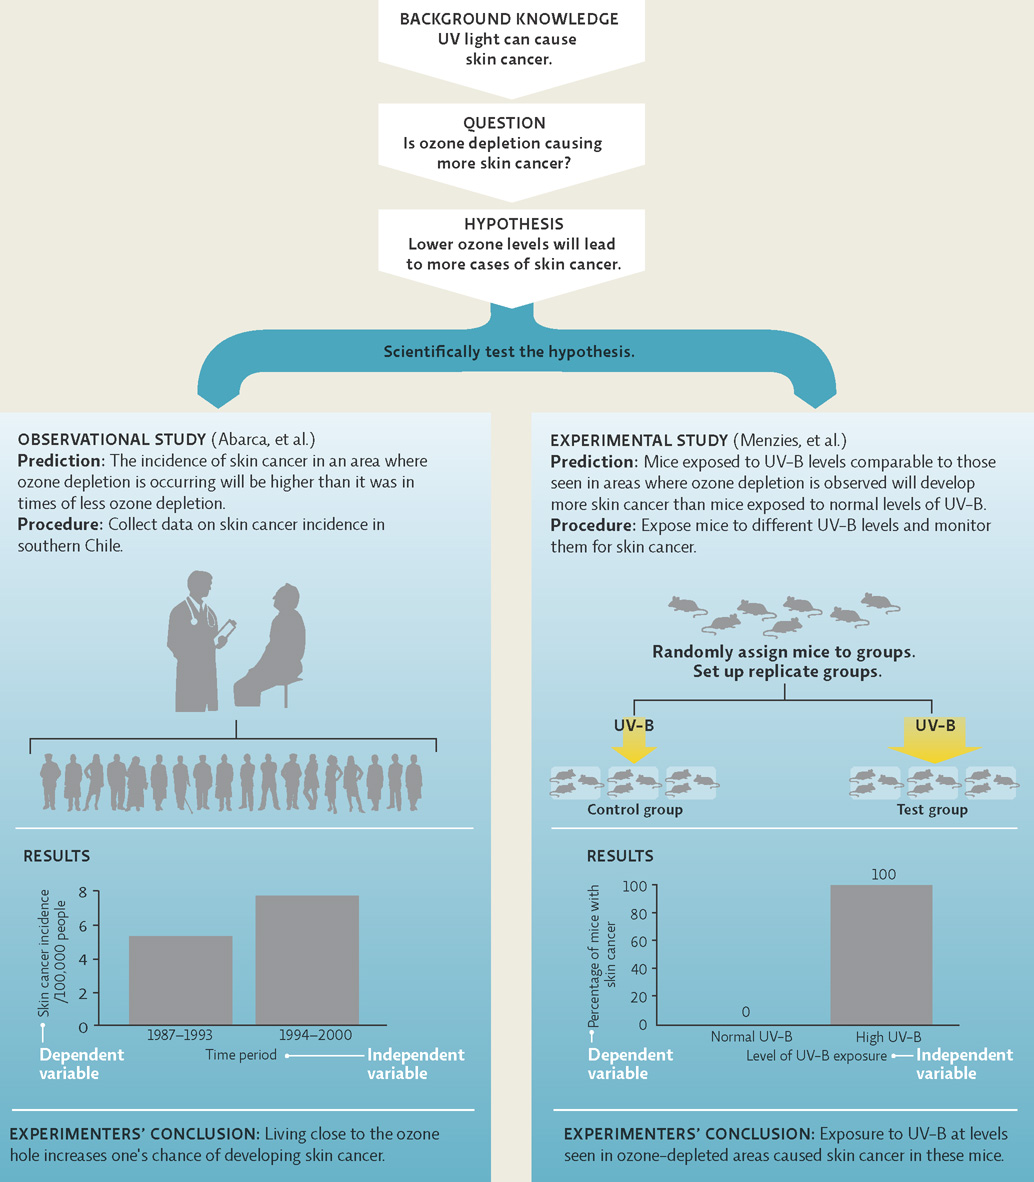
Much research is under way on how ozone depletion and elevated UV exposures are affecting living organisms. Previous studies have shown that UV exposure can increase the incidence of skin cancer. A reasonable question would be: Is ozone depletion causing more skin cancer? This could lead to an experimental hypothesis such as: Lower ozone levels will lead to more cases of skin cancer. This hypothesis generates many predictions; some would be tested with observational studies and others experimentally.
In 2002, Chilean researchers Jaime Abarca and Claudio Casiccia investigated this very hypothesis by evaluating skin cancer incidence in residents of Punta Arenas, Chile, a region exposed to higher-than-typical UV-B radiation due to its proximity to the ozone hole. Because of the ozone hole, global air circulation patterns have actually shifted; the Southern Hemisphere jet stream now circulates at a latitude closer to the South Pole, taking the ozone-depleted air over more populated regions of the Southern Hemisphere, such as southern Chile. The researchers predicted that more cases of skin cancer would be seen there in years when ozone depletion was high. To test this, they calculated skin cancer rates of the population between 1987 and 1993 and compared those to rates from the same population between 1994 and 2000. The results of their study showed that nonmelanoma skin cancer rates were significantly higher in times when ozone depletion was higher. This evidence supports their hypothesis and correlates living close to the Antarctic ozone hole with one’s chance of developing skin cancer. This observational study does not manipulate any variable—no people were exposed to higher or lower levels of UV-B or intentionally relocated to areas of higher or lower ozone depletion. The researchers simply collected data that were available in the population and then evaluated the data to see if the two variables—ozone depletion and skin cancer incidence—were correlated.
We can’t ethically manipulate people to further test this hypothesis, but we can conduct an experimental study on cells or model organisms such as mice. Australian researcher Scott Menzies and his colleagues did just that in the early 1990s: They tested the prediction that mice exposed to high UV-B radiation would develop more skin cancer than mice exposed to normal levels of UV-B radiation. This experiment compared two groups—the control group of mice, which was exposed to normal levels of UV-B radiation, and the test group, which was exposed to the same amount of UV-B radiation received in areas where ozone depletion has been observed. The two groups are identical in every way except for the test variable (in this case, the amount of UV-B radiation exposure). The inclusion of a control group is key because it allows researchers to attribute any differences seen between the two groups to the single test variable that was altered. If researchers looked only at the test group, they would have no way to determine whether the incidence of skin cancer was higher than normal.
control group
The group in an experimental study that the test group’s results are compared to; ideally, the control group will differ from the test group in only one way.
test group
The group in an experimental study that is manipulated such that it differs from the control group in only one way.
In an experimental study, we have both an independent variable and a dependent variable. We manipulate the independent variable (in this case, the amount of UV-B radiation), and measure the dependent variable (the incidence of skin cancer) to see if it is affected. In other words, if development of skin cancer is dependent on UV-B radiation, then we should see skin cancer incidence change as UV-B exposure changes. Scientists often represent their data on a graph, on which the x-axis (horizontal axis) displays the independent variable and the y-axis (vertical axis) shows the response (dependent variable). Menzies’ data showed a clear difference between his control group (none developed skin cancer) and his test group (100% developed skin cancer). It is rare to see such an absolute difference and, as with any study, we would like to see these results replicated. Regardless, a well-designed and well-conducted study increases our confidence that the results are valid. INFOGRAPHIC 2.6
independent variable
The variable in an experiment that a researcher manipulates or changes to see if the change produces an effect.
dependent variable
The variable in an experiment that is evaluated to see if it changes due to the conditions of the experiment.
HOW DO SCIENTISTS COLLECT EVIDENCE TO ANSWER QUESTIONS?
Scientists collect evidence to test ideas. Experimental studies are used when the test subjects can be intentionally manipulated; observational studies allow scientists to look at entire ecosystems or other complex systems.
What else could have caused the increase in skin cancer seen in the Abarca study?
More time spent in the sun, less sunscreen use, more fair-skinned people moving to the region.
Do the results from the Menzies study tell us anything about how other species would respond to these levels of UV-B radiation exposure? Explain.
No - tests would have to be done on other animals as well. Testing different species would also be needed -- if similar results were seen with all or most species tested then we would be more confident in generalizing that this effect would be seen in humans and other untested species. Since we can't test humans this way (cells in culture could be tested) we would also depend on studies like the observational study in Chile for evidence of its effect on humans.
Both observational and experimental studies gather data systematically to produce scientifically valid evidence. In contrast, anecdotal accounts (individual occurrences or observations) represent data that was not systematically collected or tested and cannot be compared to any control (because many uncontrolled variables exist). While anecdotes are not considered acceptable scientific evidence, a claim based on anecdotal accounts could be tested to see if a correlation or cause-and-effect relationship exists.
34
35