A variety of methods can reduce E. coli contamination.
The vast majority of E. coli are harmless to both cattle and humans. In fact, most are good—helping us to digest food that we otherwise might not be able to. But sometime pretty recently, in the long sweep of evolution, the 157 strain managed to acquire two Shiga toxin genes from a bacterium that causes dysentery. “They’re pretty potent toxins,” says Ebner. “Exposure to just ten colonies or so is enough to get someone very, very sick. You see not only kidney failure but in some of the worst cases, paralysis and even death.”
30-13
30-14
KEY CONCEPT 30.5
Better care of animals before slaughter and better handling of meat afterward can decrease bacterial contamination of the meat.
Cattle are not adapted to digest corn, and some scientists have suggested that corn-rich diets are responsible for the development of 157: By disturbing the stomach lining, corn makes the gut more acidic and thus facilitates the evolution of acid-tolerant bacteria like 157. But Ebner says current data do not support this idea. For one thing, studies comparing the incidence of 157 in cattle fed a high-forage, high-fiber diet to cattle fed a typical grain diet have not shown a consistent difference between the two. “It’s really hit or miss,” he says. “In both groups, we found cows that were positive on Tuesday and then negative on Wednesday and then positive again on Thursday.” Ultimately, the gut of a cow is a complex ecosystem, and there are likely a variety of factors that contribute to the emergence of 157, making it difficult to pin down the causes.
At any rate, he says, the bigger concern is not how 157 evolved, or even what triggers its growth, but how best to control it. Part of the challenge is that 157 does not affect cows the way it affects humans. In fact, it doesn’t affect them much at all. It simply resides in their intestinal tract, near the last section of the colon, doing no harm, eventually passing to the soil in the animal’s feces. Even that translocation would not be a problem if the cow were cleaned and butchered properly. But animals living in small, high-density pens tend to get feces on them, and when they aren’t cleaned properly when slaughtered, that feces, and the E. coli that comes with it, can come in contact with the meat and be passed on to the consumer.
In general, Ebner says, farmers have two basic options for preventing this, and they are evenly spilt over which is likely to be more effective. Preharvest strategies—including antibiotics or a change in diet—aim to kill the bacteria in live cattle, or at least reduce the number living in the animal’s colon. Postharvest strategies—like irradiation or intense washing—aim to remove the contamination from slaughtered carcasses.
Beef industry leaders say that they’re doing a good job. 2007 was a bad year, to be sure, but those headline-making incidents belie a much less frightening reality: Meat is safer today than it’s ever been. “Even when you take last year into account, it’s nowhere near where it was even 6 years ago,” Mohammad Koohmaraie, a former director of the U.S. Department of Agriculture (USDA) Meat Animal Research Center, told Beef magazine in 2008. “Before [2007] everyone was bragging on what the beef industry had done.” In fact, in 1996, a government-led initiative set out to reduce the number of E. coli O157:H7 infections by one-third, come 2010. By 2004, the industry had exceeded that goal.
But critics say that even those few cases are too many, especially given that some have resulted in fatalities. And though cases have dropped since 1996, the Centers for Disease Control and Prevention goal of no more than 6 cases per million people per year has remained elusive, with little change in the number of cases per year for the past several years. INFOGRAPHIC 30.5
TRENDS IN U.S. FOODBORNE ILLNESS SINCE 1996
The CDC tracks foodborne illnesses in the United States. This graph shows data for five of the most common pathogens in laboratory-confirmed infections. The actual numbers of cases are not shown here, just how much the rate of incidence increased or decreased compared to the number of cases for each pathogen in the 1996–1998 time period. Since its high in 1999, E. coli O157 has declined (with ups and downs) but is still above the CDC 2020 target of no more than 0.6 cases per 100,000 people.
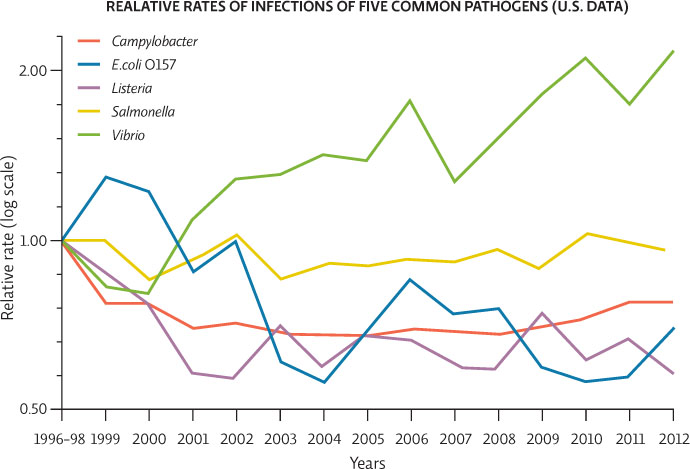

Vibrio infections, often acquired from eating raw oysters, appear to be on the rise. These infections are rare (0.41 cases per 100,000 people in 2012 compared to 16.37 cases per 100,000 people for Salmonella, the most common foodborne infection). Why then is the 2012 data point for Vibrio higher than the line for Salmonella?
The graph is showing the rate of infection of each pathogen for any given year compared to its rate in 1996-1998. Vibrio infections are lower than Salmonella but they are higher relative to what they were in 1996-1998. Comparing these lines is only useful to see which infections are on the rise, falling, or holding steady. The lines tell us nothing about absolute numbers of cases.