Factors that decrease the death rate can also decrease overall population growth rates.
When Qin Yijao’s mom was pregnant with him back in 1981, the one-child policy was being strictly enforced, and she already had a son. “People from the Communist Brigade said I couldn’t have a second baby,” the mother told National Public Radio (NPR) in a 2005 interview. “But I was determined. I needed a son to work our farm.” So taking care to evade the birth police, she snuck off and delivered her son in a cave. When she was found out, she was penalized. “I had to pay double the price for grain, and they confiscated our television and sewing machine.” In the end, she got to keep and raise her son. But at 30, he has never worked a single day on the farm. “I don’t even know where my mom’s farm plot is,” Qin also told NPR, adding that while he appreciates the risks his mother took, he and his wife have no desire for a second child themselves. The anecdote underscores a key point: Chinese culture has changed dramatically in the years since the one-child policy was enacted, becoming much more urban and thus lessening the need for farmhand children. Many demographers say that such social changes may be more responsible for smaller families than the policy itself.
KEY CONCEPT 4.5
Helping low-income countries develop economically may spur a demographic transition similar to that experienced by many industrialized countries.
71
The demographic transition holds that as a country’s economy changes from preindustrial to postindustrial, low birth and death rates replace high birth and death rates. The reasons are cultural as much as economic. As health care improves, infant mortality declines, and with it, the need for couples to have many children just to ensure that some make it to adulthood. As cities grow and jobs materialize, the need for children to work the farm decreases. Meanwhile, as women find themselves with more opportunities, better health care, and greater access to education, many come to want fewer children. INFOGRAPHIC 4.5
demographic transition
A theoretical model that describes the expected drop in once-high population growth rates as economic conditions improve the quality of life in a population.
DEMOGRAPHIC TRANSITION
Some industrialized nations have gone through the demographic transition from high birth and death rates to low birth and death rates, giving them a stable population. It is unclear whether industrialization will produce the same pattern in all developing countries. Steps to improve the quality of life and decrease death rates are important worldwide, even if other measures are needed to slow birth rates.
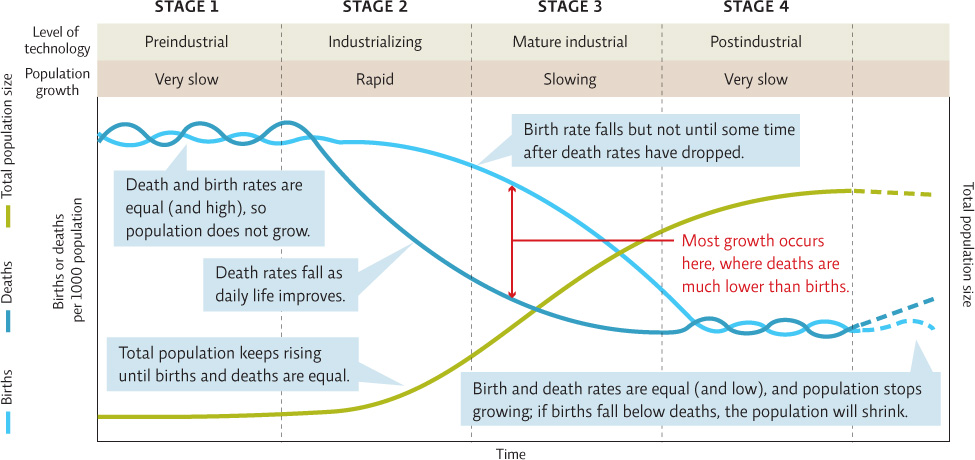

Why might industrialization not lead to a demographic transition in all countries?
In some countries industrialization might improve the quality of life and decrease death rates, but it might not decrease birth rates if there are other pronatalist pressures keeping the population high. In other areas, death rates may not fall, even with industrialization if large segments of the population do not benefit from the increased economic benefit of industrialization.
More developed countries, including the United States and countries of the European Union, have already undergone the demographic transition. Demographers are split over whether other countries are likely to do the same. But that uncertainty has not stopped world leaders from trying to cull lessons from the demographic transition model. Around the world, countries from Bangladesh to Brazil are working to reduce pronatalist pressures, increase gender equality, and combat poverty and infant mortality, all in an effort to improve standards of living, which in turn should lower fertility rates. The ultimate goal is to achieve zero population growth, when population size is stable, neither increasing nor decreasing. This occurs when the number of people born equals the number of people dying—in other words, when the population reaches the replacement fertility rate.
zero population growth
The absence of population growth; occurs when birth rates equal death rates.
replacement fertility rate
The rate at which children must be born to replace those dying in the population.
In the United States, the replacement rate is 2.1 (rather than the expected 2.0), since a few children die before maturity and not every female has children. In countries with high infant mortality rates, the replacement rate is higher.
72
At least a handful of clues suggest that the demographic transition in China is as responsible for reductions in total fertility rates as is the one-child policy. Clue number one: The most significant fertility declines in the policy’s history coincided with the largest gains in the Chinese economy, not with periods of strict enforcement. Clue number two: Many other countries have had substantial declines in fertility during the past 25 years without the use of strict population-control policies, including Japan, Singapore, and Thailand, whose fertility rates mirror those of China’s almost exactly—falling from 5 children per family in 1970 to 1.8 children per family in 2011.
“The parallels are hard to ignore,” says Therese Hesketh, a global health professor at University College London. “[They suggest] that China could have expected a continued reduction in its fertility rate just from continued economic development.” Feng puts it more bluntly. “The claim that one-child prevented 400 million births is bogus for sure,” he says. “Many other countries experienced nearly identical fertility declines over the same time frame. So unless you say Chinese people are necessarily different from other populations, it’s very hard to argue the decline is due to government policy.”
KEY CONCEPT 4.6
Currently, the global population growth rate is decreasing, but it is not yet zero, so the world’s population is still increasing.
Worldwide, population growth rates are declining, but overall the number is still positive, so we are still increasing. The United Nations estimates future population size leveling off somewhere between 6 and 16 billion people by 2100, depending on how quickly we reduce growth rates (see Infographic 4.1). INFOGRAPHIC 4.6
DECLINING POPULATION GROWTH RATES
Although global growth rates are decreasing, the overall world population is still on the rise, just more slowly. Only when growth rates reach zero will our population stop growing. The growth rate of a country as big as China can strongly influence global growth rates, as evidenced here by the substantial dip in the late 1950s.
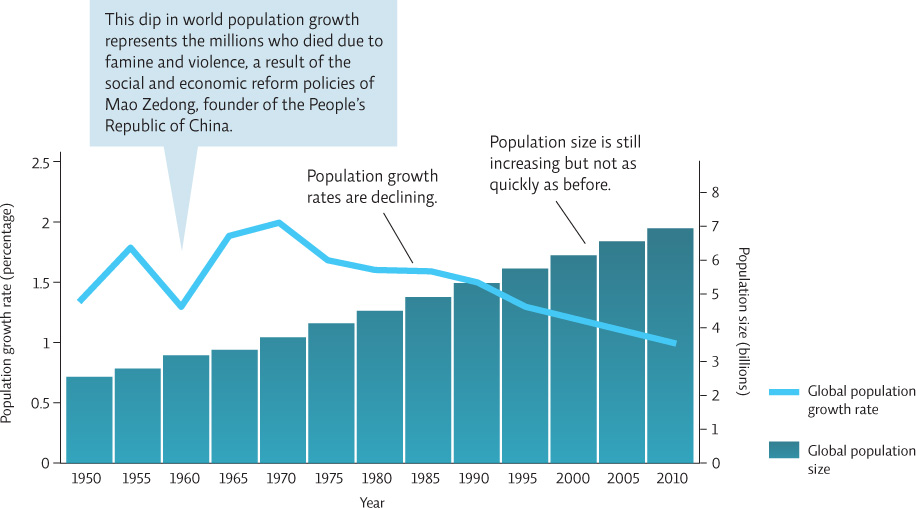
For the time period shown in this graph, in what year was the human population growth rate the highest? When was the human population size the greatest?
The growth rate peaked in 1970; human population was highest in 2010
But if the predominant causes of declining fertility remain a source of debate, the consequences are becoming clearer and more stark by the day. Because the reasons for population growth are likely to be different in different regions, reaching zero population growth requires that the pronatalist pressures in each region be addressed. A variety of measures that don’t include government-restricted family size have proven successful.
Programs that address the needs of a given population and work within the cultural and religious traditions are likely to be most successful. Many demographers believe that addressing the social justice issues associated with overpopulation (poverty, high infant mortality, lack of education and opportunities for women) will prove the most instrumental in enabling countries with high TFRs to confront what lies ahead. For example, programs that improve health care also increase the survival of infants and children; education and job opportunities for women have been shown to reduce the desired family size. Targeting such health, education, and family planning programs in specific regions of the country where there is an unmet need for such services can lead to significant reductions in TFR. Targeting areas of unmet need has been particularly effective in other fast-growing regions of the world, such as many African nations, where as many as 39% of the woman in rural areas want birth control but have no access to it. But such efforts can work only when paired with cultural and societal shifts that reduce the desired family size. INFOGRAPHIC 4.7
REACHING ZERO POPULATION GROWTH
Reaching zero population growth takes two steps: identifying why birth rates are high (what are the pronatalist pressures?) and then taking steps (education, birth control, social campaigns) to address those pronatalist pressures and reduce birth rates.
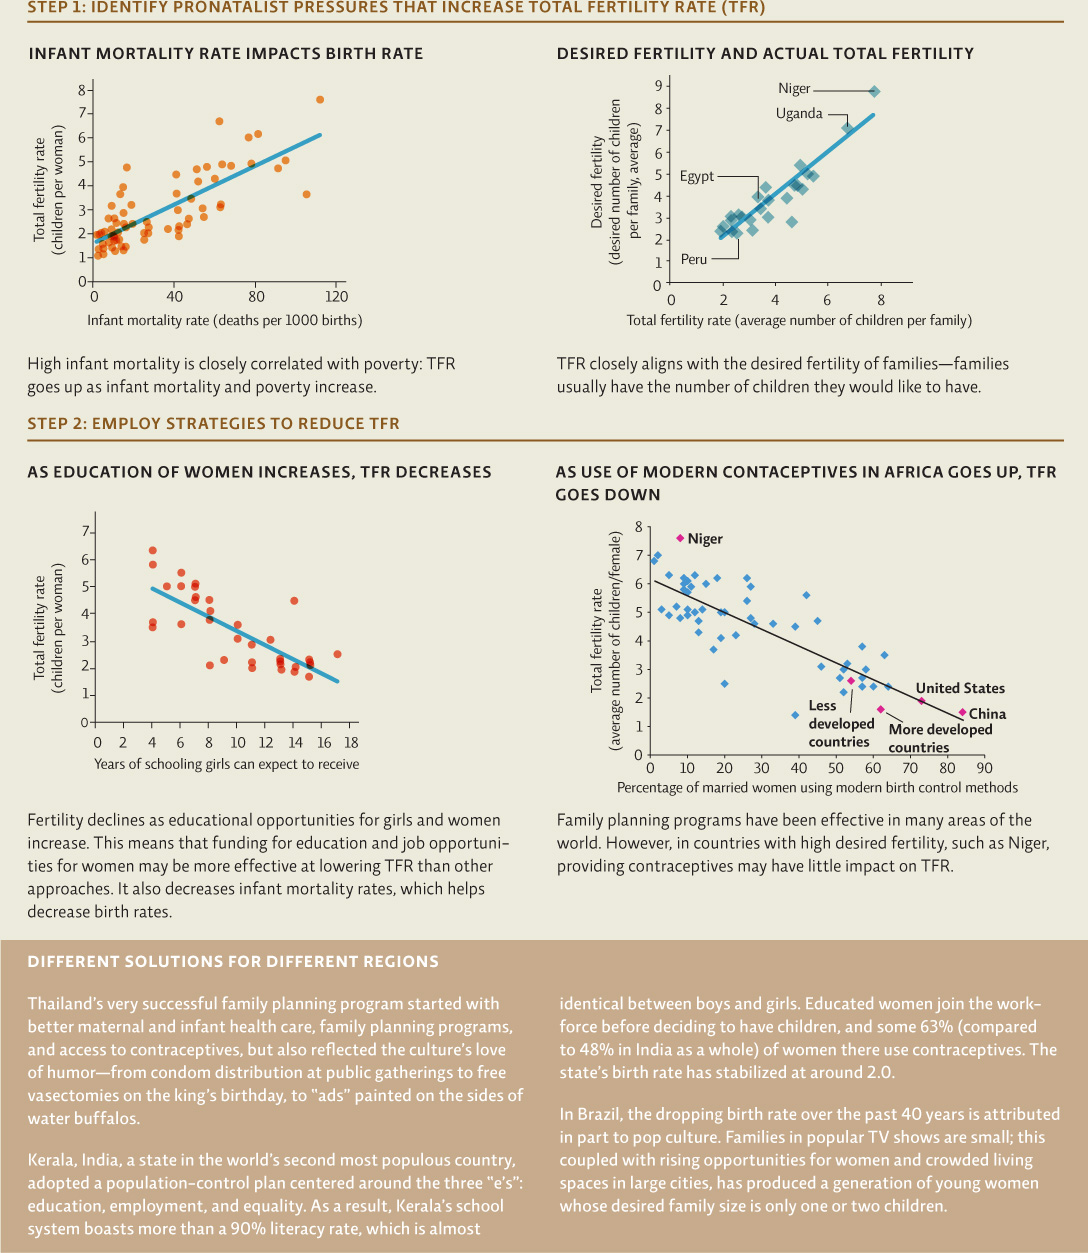
Which of the graphs shown here depict positive correlations? Which are negative correlations? Are positive correlations “good” and negative correlations “bad”? Explain.
Positive correlations: infant mortality vs. birth rate; desired fertility vs. actual total fertility. Negative correlations: education of women and TFR; use of modern contraceptives in Africa and TFR. The descriptor, positive or negative, does not imply anything about whether the relationship seen is good or bad. Positive correlations simply show that as one factor increases in size, so does the other (and vice versa: as one factor decreases, so does the other). When two variables are negatively correlated, as one increases in size, the other decreases in size.
73