SCIENCE LITERACY WORKING WITH DATA
China and the United States are two of the world’s largest consumers of resources due to sheer population size and per capita consumption rates. Look at graphs A and B which come from the Earth Policy Institute’s article “Learning from China: Why the Existing Economic Model Will Fail.”
Interpretation
Question 6.16
What do these figures show? How many different fuel types are included in the figures?
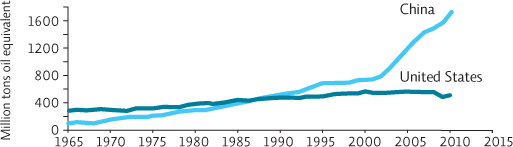
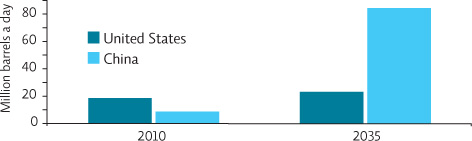
The graphs show real and projected trends in the consumption of two fossil fuels—coal and oil—in China and the United States. Graph 1 compares the coal consumption of China to that of the United States from 1965 to 2010, while graph 2 compares oil consumption of China to that of the United States in 2010 as well as a projection of what it might look like in 2035.
Question 6.17
How did China and the United States compare in their use of coal and oil in 2010? Use the data to explain your response.
In 2010, China used more coal than the United States. While United States coal consumption was 525 million tons of coal, (measured as oil equivalent), China’s coal consumption was more than three times that at around 1,700 million tons (measured as oil equivalent). The United States also consumed more oil than China in 2010. While United States oil consumption was about 19 million barrels per day, China was about half that at 9 million barrels.
Question 6.18
What is the projected oil consumption for China in 2035, and how does this compare to what is projected for the United States? What is the potential percentage change in oil consumption for each country? How does this trend compare to coal consumption for the two countries?
Oil consumption in China in 2035 is projected to be more than 3.5 times that of the United States. While it is expected that United States oil consumption will increase only slightly to about 23 million barrels per day—an increase of only about 17%—oil consumption in China will increase by over 89% to 85 million barrels. This trend in oil consumption is similar to that of coal as the United States used more coal than China until around 1986 after which China steadily used more coal each year and in 2010 used three times as much coal as the United States.
Advance Your Thinking
Question 6.19
China’s ecological footprint is much smaller than that of the United States. What explains the trend in coal consumption in China and why it exceeds that of the United States today? Using the IPAT model, how might China and the United States compare?
Given that China’s population is much larger (1.3 billion) than that of the United States (300 million), the per capita coal consumption and hence the ecological footprint of each Chinese person is smaller than that of an average American even though China’s overall consumption is larger.
For the IPAT model, both the United States and China are likely to have large environmental impacts. For the United States the larger impact is likely due to higher affluence per capita (A in the IPAT equation) while for China the larger impact is likely due to a larger population (P in the equation).
Question 6.20
The world produces 86 million barrels of oil a day. What percentage of this oil production did the United States consume in 2010? China? How does this translate into per capita consumption, if the current population of China is 1.3 billion and that of the United States is 300 million? Assuming that we hold to this level of oil production, what proportion of it will China need in 2035? What about the United States? How does this translate in per capita terms, assuming that the population sizes in China and in the United States do not change significantly? Discuss the environmental consequences in terms of the IPAT model and the ecological footprint.
In 2010, the United States consumed 22% of the world’s oil while China consumed about 10%. In per capita terms this translates into the average Chinese person consuming about 0.007 million barrels of oil a day (9 million barrels of oil/1300 million people) while the average American consumed 0.06 million barrels of oil a day (19 million barrels of oil/300 million people).
Assuming that we hold to current levels of oil production, it is projected that in 2035 China will require 85 million barrels of oil a day which would account for almost 99% of current oil production, while the United States would require about 22 million barrels of oil a day, accounting for just over 25% of current oil production. Assuming that the population in both countries does not change significantly, China’s per capita oil consumption will be 0.065 million barrels of oil a day (85 million barrels of oil/1300 million people) while the average American will consume 0.07 million barrels of oil a day (22 million barrels of oil/300 million people).
Assuming China’s population stabilizes around 1.3 billion, the increase in oil consumption would reflect a higher per capita use of oil (presumbably from higher incomes - perhaps close to current United States levels in 2035). This would meaning a higher level of affluence and more consumption (also equivalent to that of the United States). By then China’s per capita ecological footprint could likely be equal to that of the United States but its environmental impact will be much higher because of its much larger population.