22.3 Evidence of global climate change abounds.
By all accounts, the forests of Northern Minnesota are places of uncommon majesty. Moose and deer meander through an ocean of trees—some of them close to 1000 years old—that grow out of colossal, hundreds-of-metres-high granite hills whose outcrops reflect the colours of day: pale, soft pink when the Sun rises, and deep, sombre rouge when it sets. The serenity belies an unsettling truth: this forest, which has existed for more than 3000 years—since the early days of the Roman Empire—and even inspired the U.S. Wilderness Act of 1964, could vanish within the next century.
To Frelich’s well-trained eye, the signs are obvious. He has spent his entire adult life trekking through this ancient landscape, observing it and cataloguing the changes—centimetre by centimetre, leaf by leaf. So it’s no surprise that when he looks on the placid landscape, he sees a catastrophe unfolding. In one patch of forest, scrawny, young birch trees bud several weeks ahead of schedule. In another, adult birches are dying off rapidly, leaving a graveyard of bony white trunks. “A long growing season is not good for this tree,” Frelich says, “because it goes hand in hand with warmer soil, which the paper birch doesn’t tolerate well.” Meanwhile, red maple, a temperate species that grows as far south as Louisiana, but is far less common up north, is thriving in northeast Minnesota’s Sea Gull Lake area. “When you have red maples growing as much as 4 feet in a single year,” says Frelich, “you are not talking about a boreal climate anymore.”
394
Regional climate data correlates well with the changes Frelich sees. In the past two decades, springtime has come ever earlier to the region—a week or two sooner than the historical average, according to the Minnesota Department of Natural Resource’s climatology office. Nine of the state’s 20 warmest years have been recorded since 1981. And for the first time in recorded history, Minnesota logged three mild winters in a row, each with record highs: 1997, 1998, and 1999.
Those data correspond to larger global trends. Overall, 2000 to 2010 is the warmest decade on record, since climatologists started keeping records back in 1850. The seven warmest years occurred between 1998 and 2010, with 2005 and 2010 tying for warmest individual year. According to the U.S. National Oceanic and Atmospheric Administration (NOAA), the global land average temperature increased by 0.66°C in 2010, compared to the 20th-century average. The year 2012 was a record-breaker in North America with U.S temperatures 1.8°C higher than normal. Even more telling, 2012 represented the 36th year in a row that exceeded the long-term average—the sign of a shift in climate rather than just natural variability of weather. In higher latitudes, it’s even worse: temperatures have increased by 5°C or more. Sea surface temperatures have also increased, by almost 3°C in some places. In Canada, 2012 ranked as the 4th warmest year on record, with areas such as Windsor and Quebec City experiencing record-breaking spring and summer temperatures. The winter of 2011/2012 was 3.6°C higher than the baseline average from 1961-1990, and this was only the 3rd warmest winter. The winter of 2009/2010 holds the record so far, at 4.1°C above baseline.
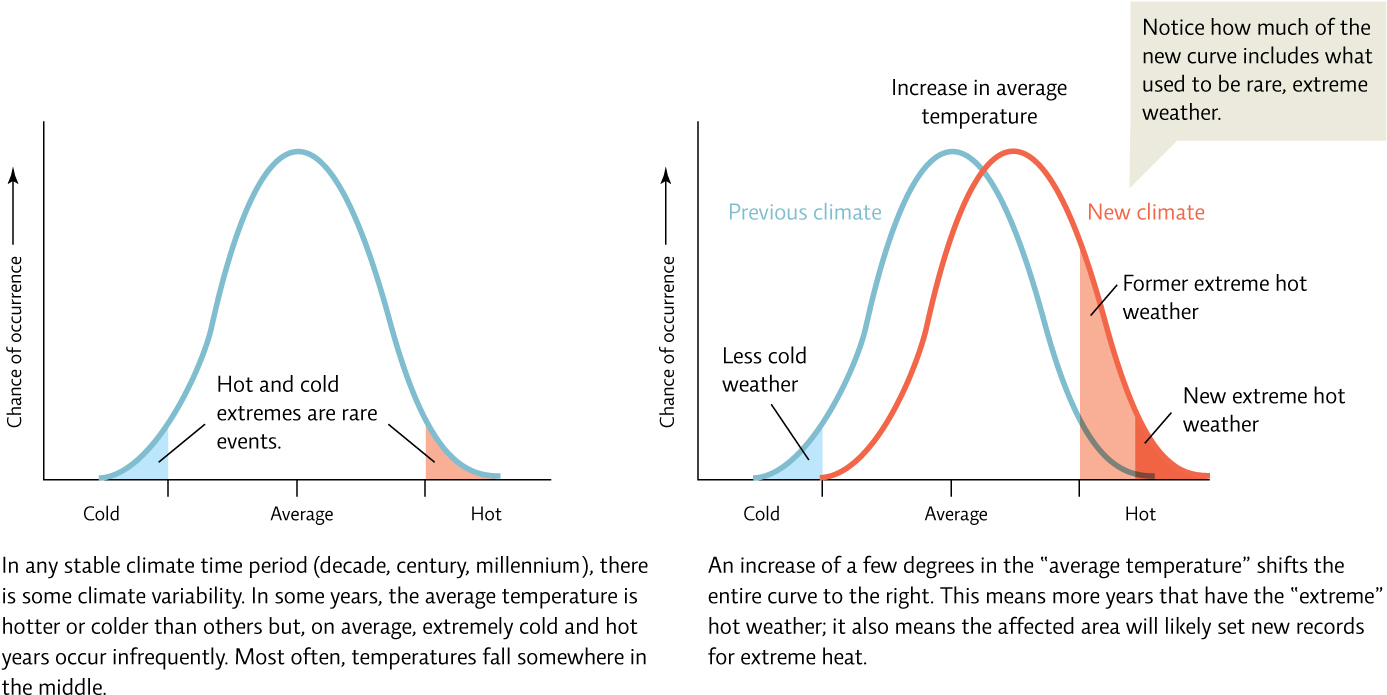
A few degrees might not seem like much. But even such seemingly small changes in climate can have tremendous impacts on weather, and thus on natural ecosystems and human societies. [infographic 22.1]
395
In fact, we are already seeing some big effects, especially in the Arctic, which is particularly vulnerable to climate change because warming that occurs there causes ice to melt, which triggers additional warming. Warming in the Arctic is also affecting weather around the world. A recent study shows that climate change is altering the northern hemisphere’s polar jet stream, slowing it down and making it “wavier,” meaning the peaks and troughs of the jet stream are extending farther north and south as the jet stream moves from west to east. This brings colder than normal air farther south and can slow down the movement of weather systems, sometimes causing them to stall and dump excessive amounts of snow or rain in one area. Essentially, cold Arctic air is reaching farther south than normal, more often than normal, and for longer periods of time, contributing to extreme winter weather events such as those seen in North America and Europe in recent years.
So how quickly is the Arctic warming? In 2011, researchers at Cambridge University evaluated the weather patterns of Ellesmere Island, Nunavut, in Canada’s Arctic, and found that spring and summer temperatures were 11–16°C higher than previous years—making the climate similar to a boreal climate 1600 to 2250 kilometres farther south. But as large as that increase was, it was not entirely surprising. In 2007 and some subsequent years, researchers have measured record losses of sea ice (ice that floats on top of the ocean) in the region, including the record low that occurred in September 2012. Based on the current rate of melting, the entire Arctic could be completely ice free in the summers come 2035.
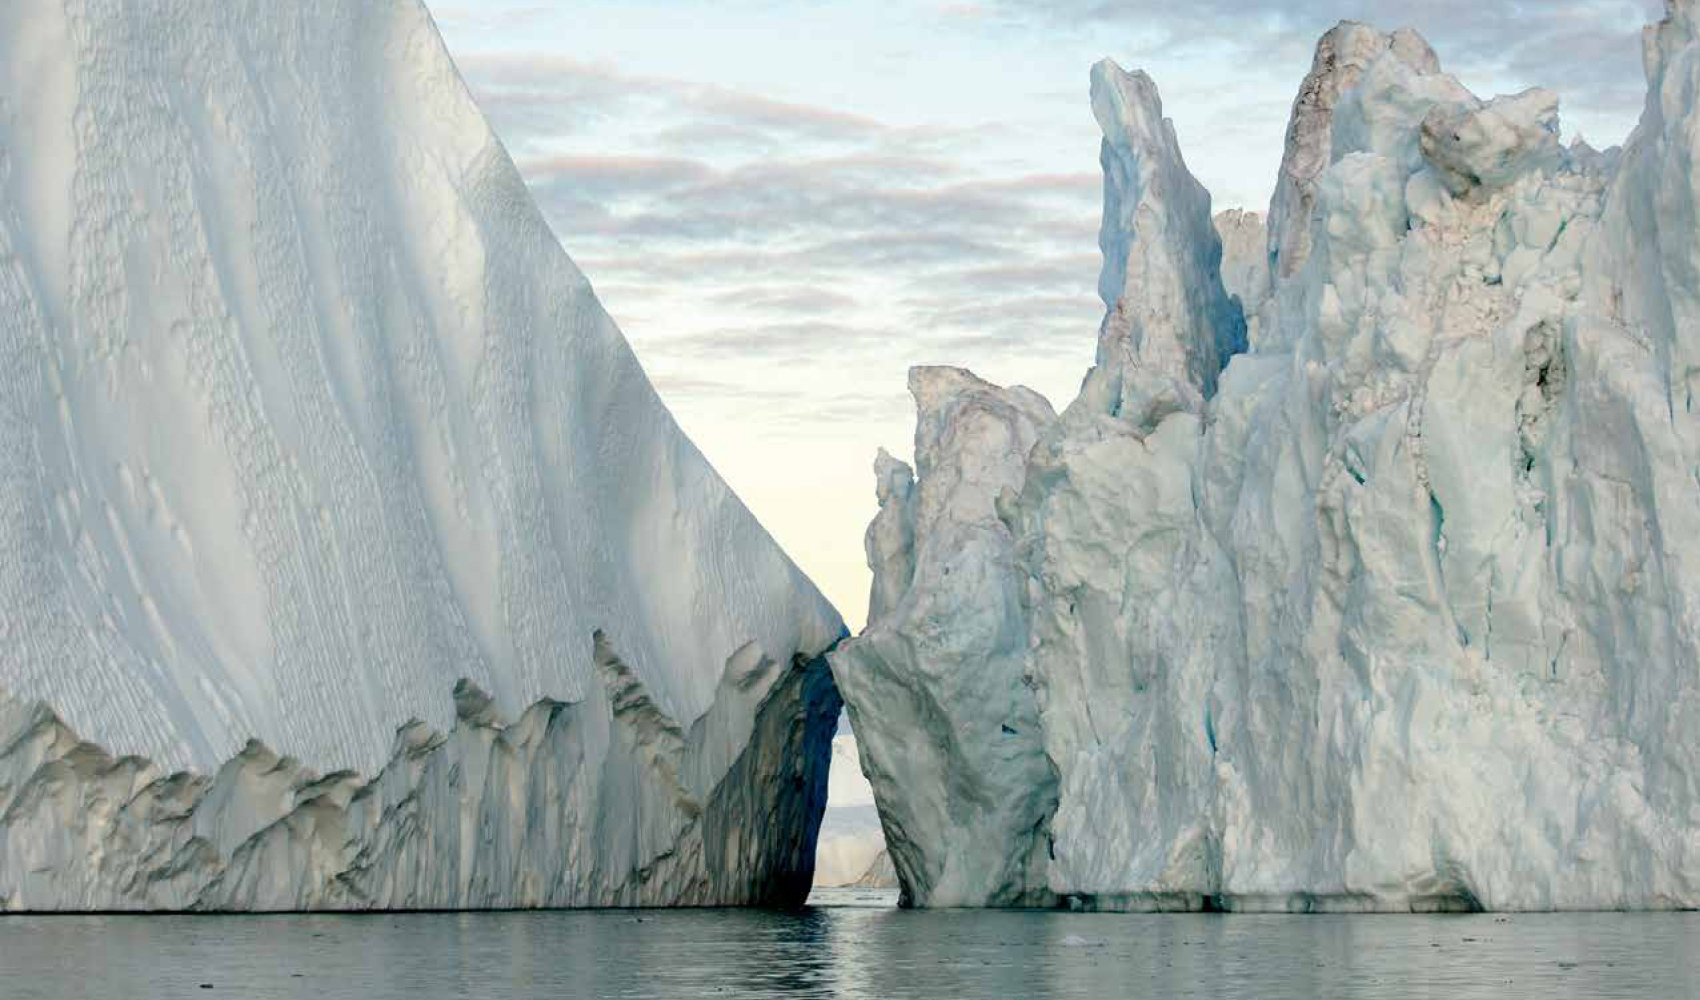
And it’s not just Arctic ice that’s melting. In fact, glaciers on the other side of the planet are dwindling just as fast as those in the Arctic, if not faster. Overall, sea ice is decreasing about 3–4% per decade. In Antarctica, the Larsen B Ice Shelf—a colossal sheet of sea ice, more than 210 metres thick and about half the size of Prince Edward Island—collapsed in 2002 in just a couple of weeks. This stunning spectacle, which took climatologists by surprise, was repeated in 2008, when the Wilkins Ice Shelf (also in Antarctica) collapsed, again in the space of 2 weeks.
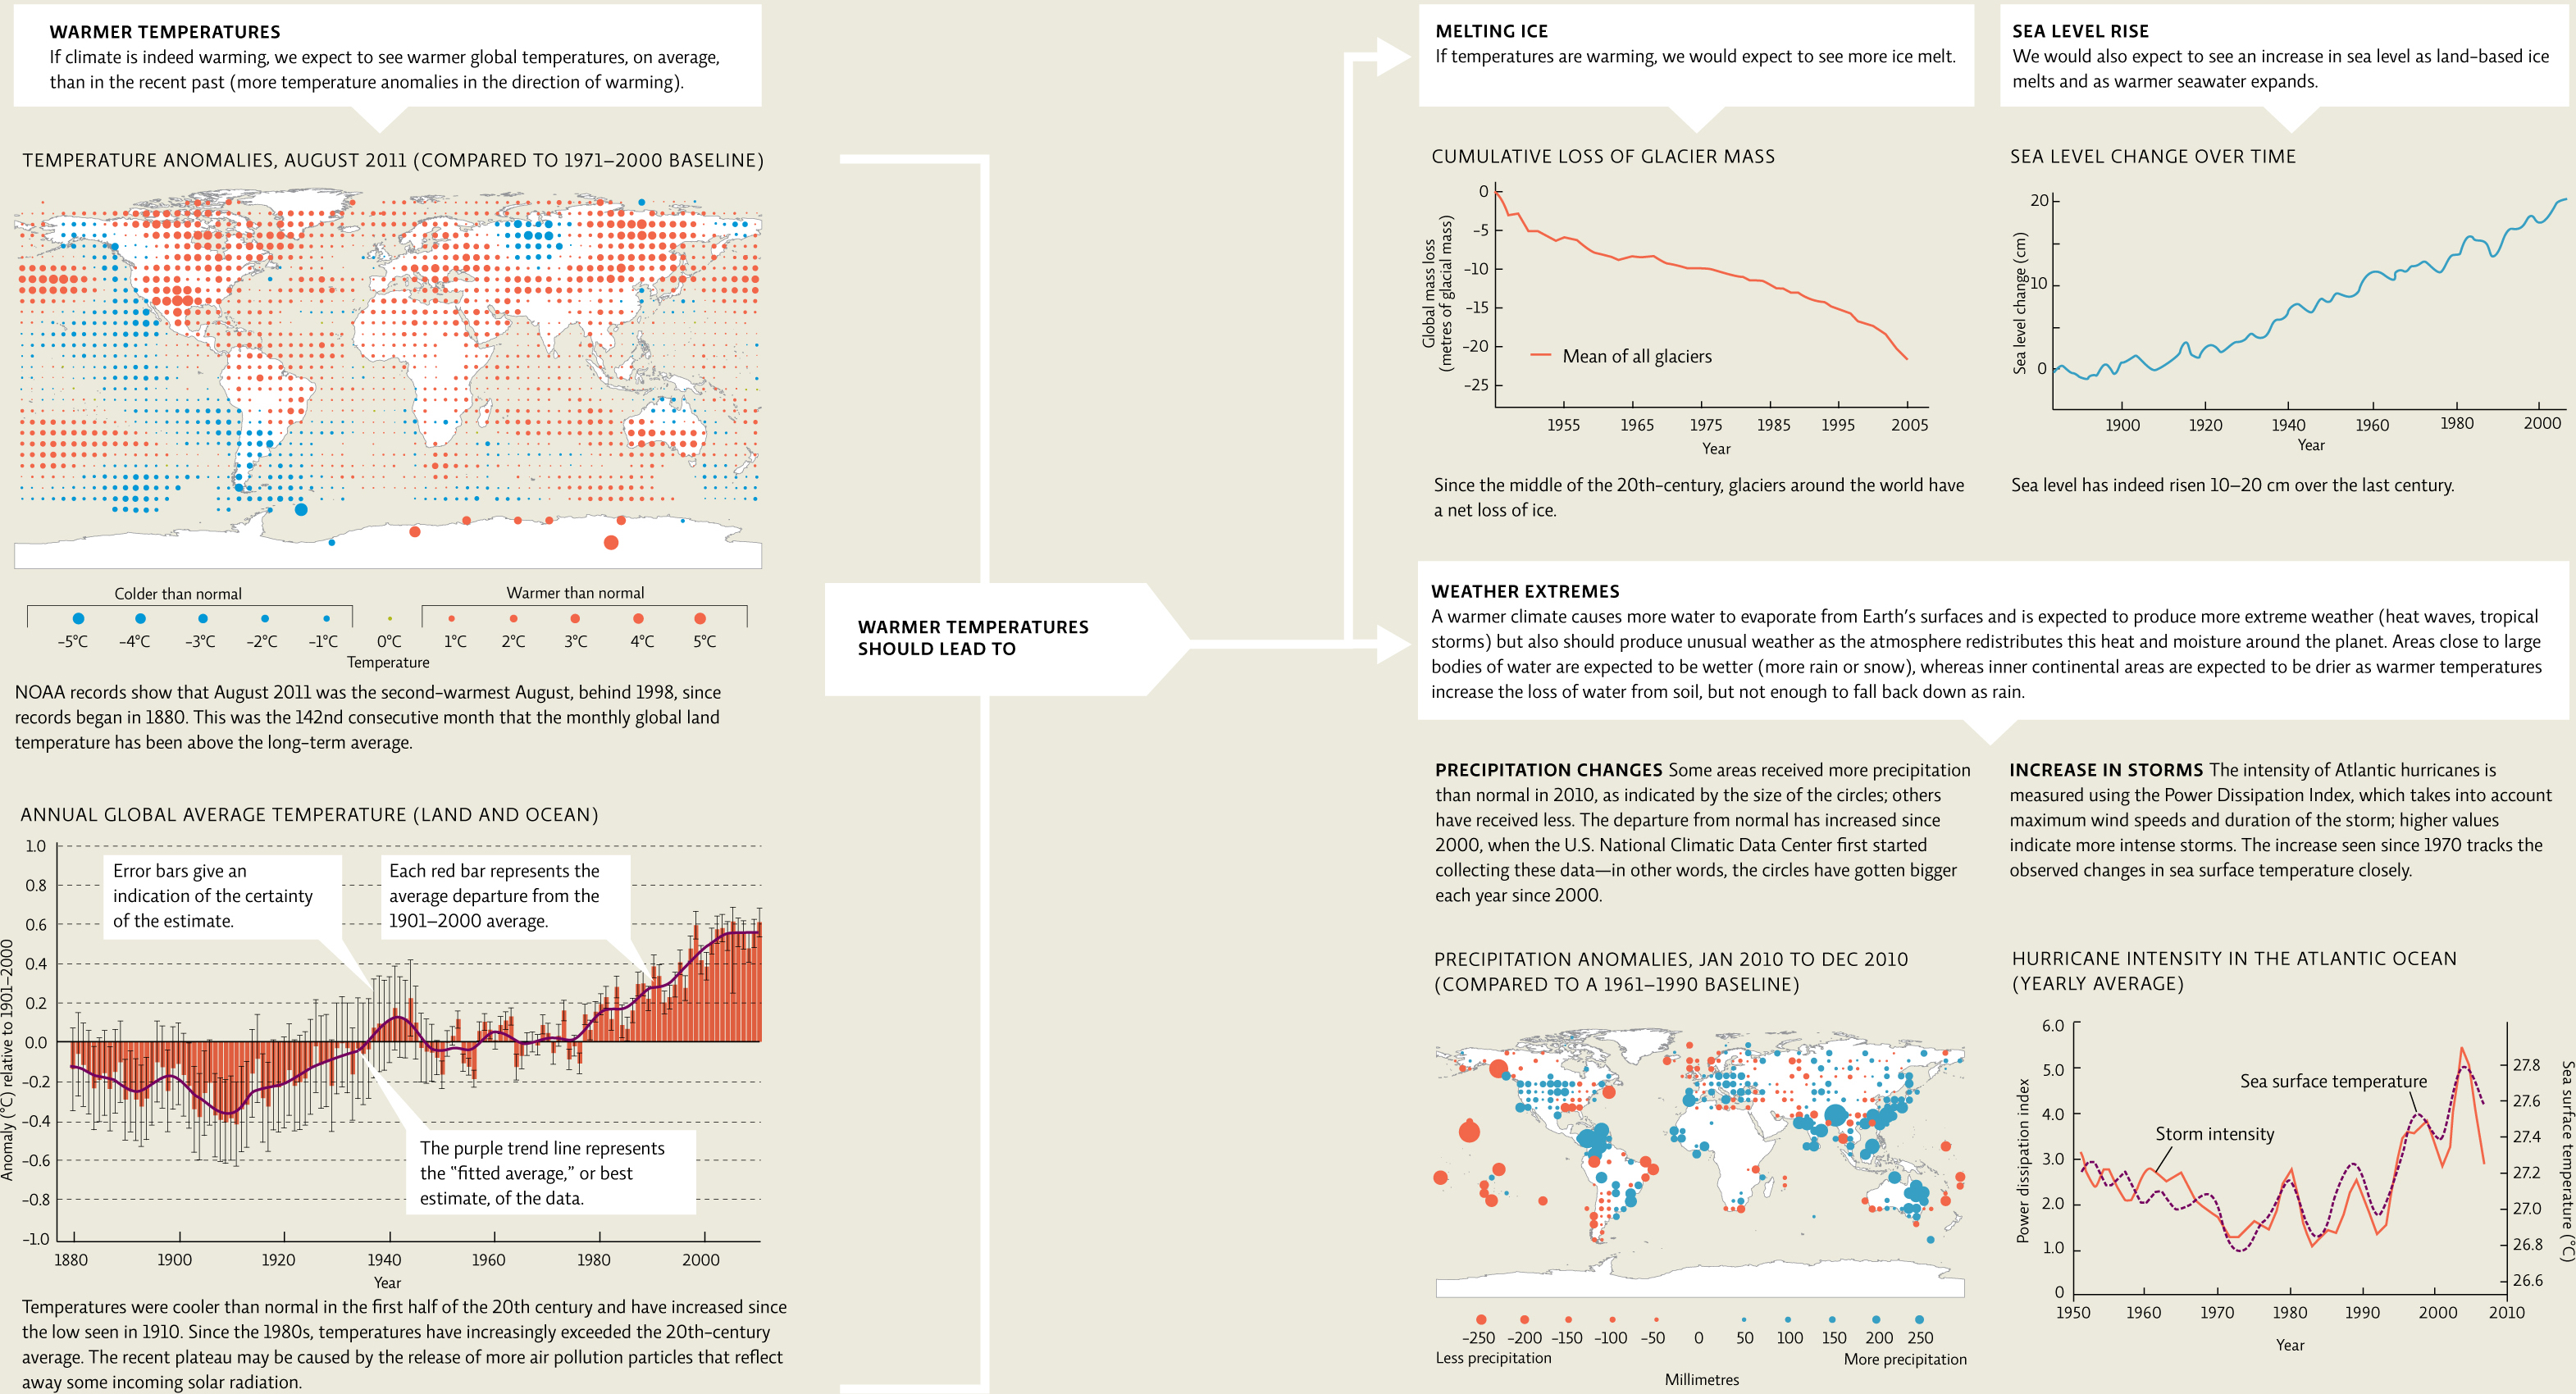
And as ice on land melts, sea levels are rising—by an average of 10 to 20 centimetres during the last century. About half of this rise is due to land-based ice melt and the other half to thermal expansion—the expansion of water molecules as they heat up. So far, rising sea levels have displaced hundreds of thousands of coastal-dwelling people around the world. [infographic 22.2]
396
397
398