22.4 A variety of factors affect climate.
So why is all this happening?
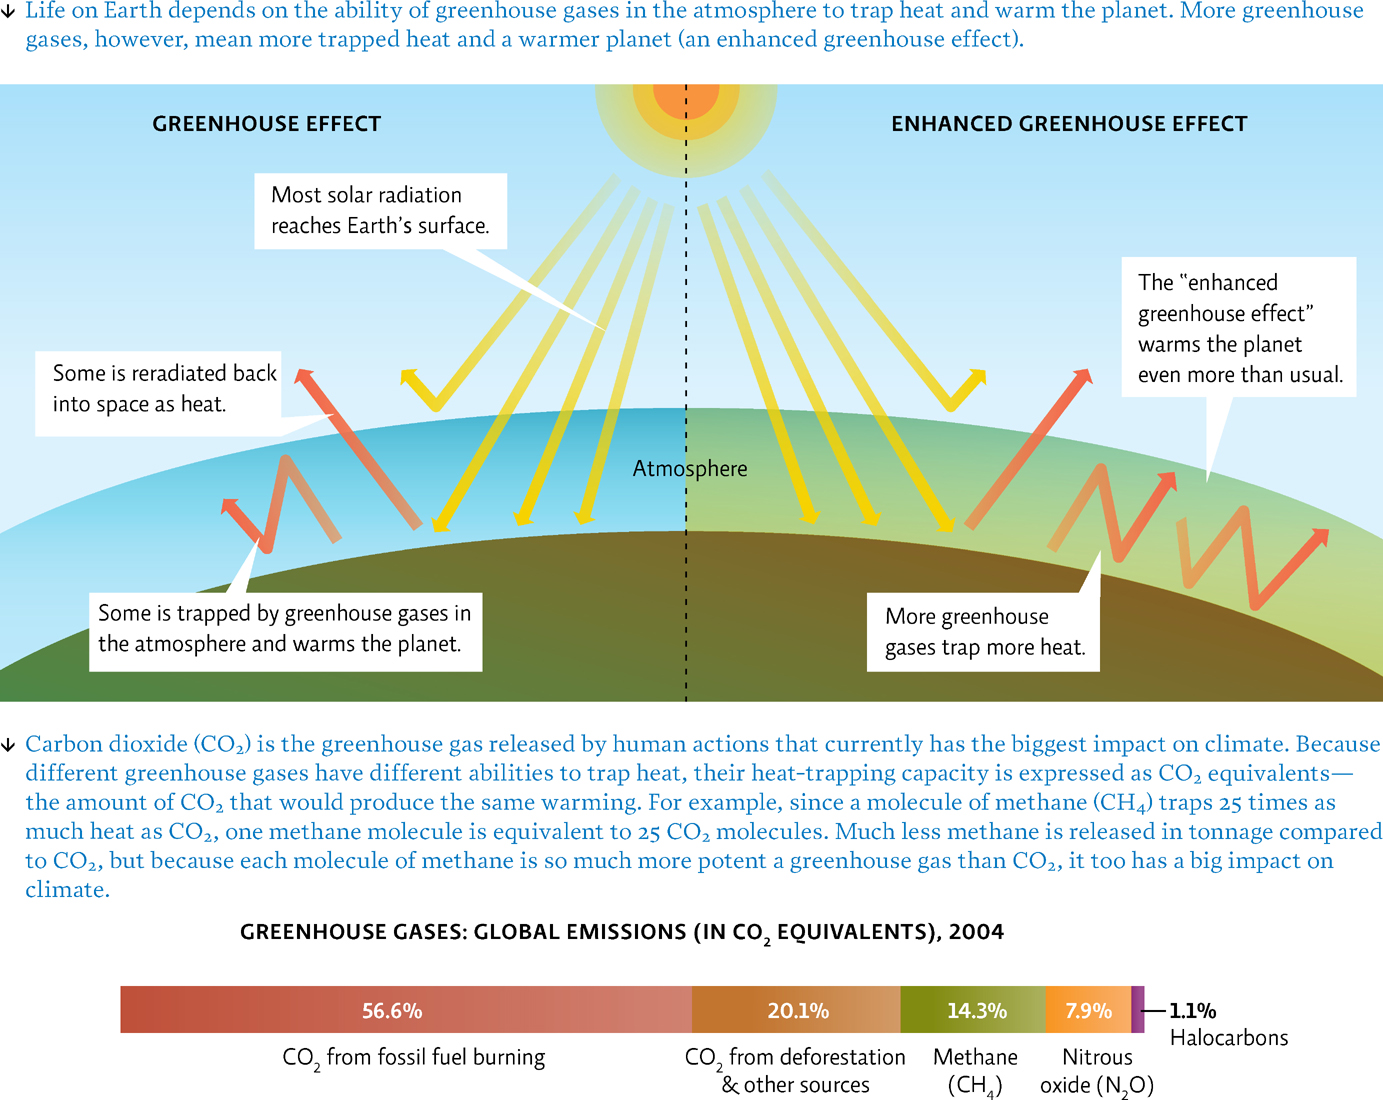
In the past few decades, scientists have discovered that the level of certain gases in Earth’s atmosphere is on the rise. These gases, called greenhouse gases—which include carbon dioxide, methane, and nitrous oxide—trap heat and help warm Earth, in a process known as the greenhouse effect. Normally, the greenhouse effect is a good thing—without it, the average temperature on Earth would be around −15°C—that’s more than 30° colder than the planet’s current average temperature! But starting in the 1980s, scientists began to see evidence of an enhanced greenhouse effect, which they believe is from the release of greenhouse gases from burning fossil fuels and other industrial and agricultural practices—in other words, from human activities. [infographic 22.3]
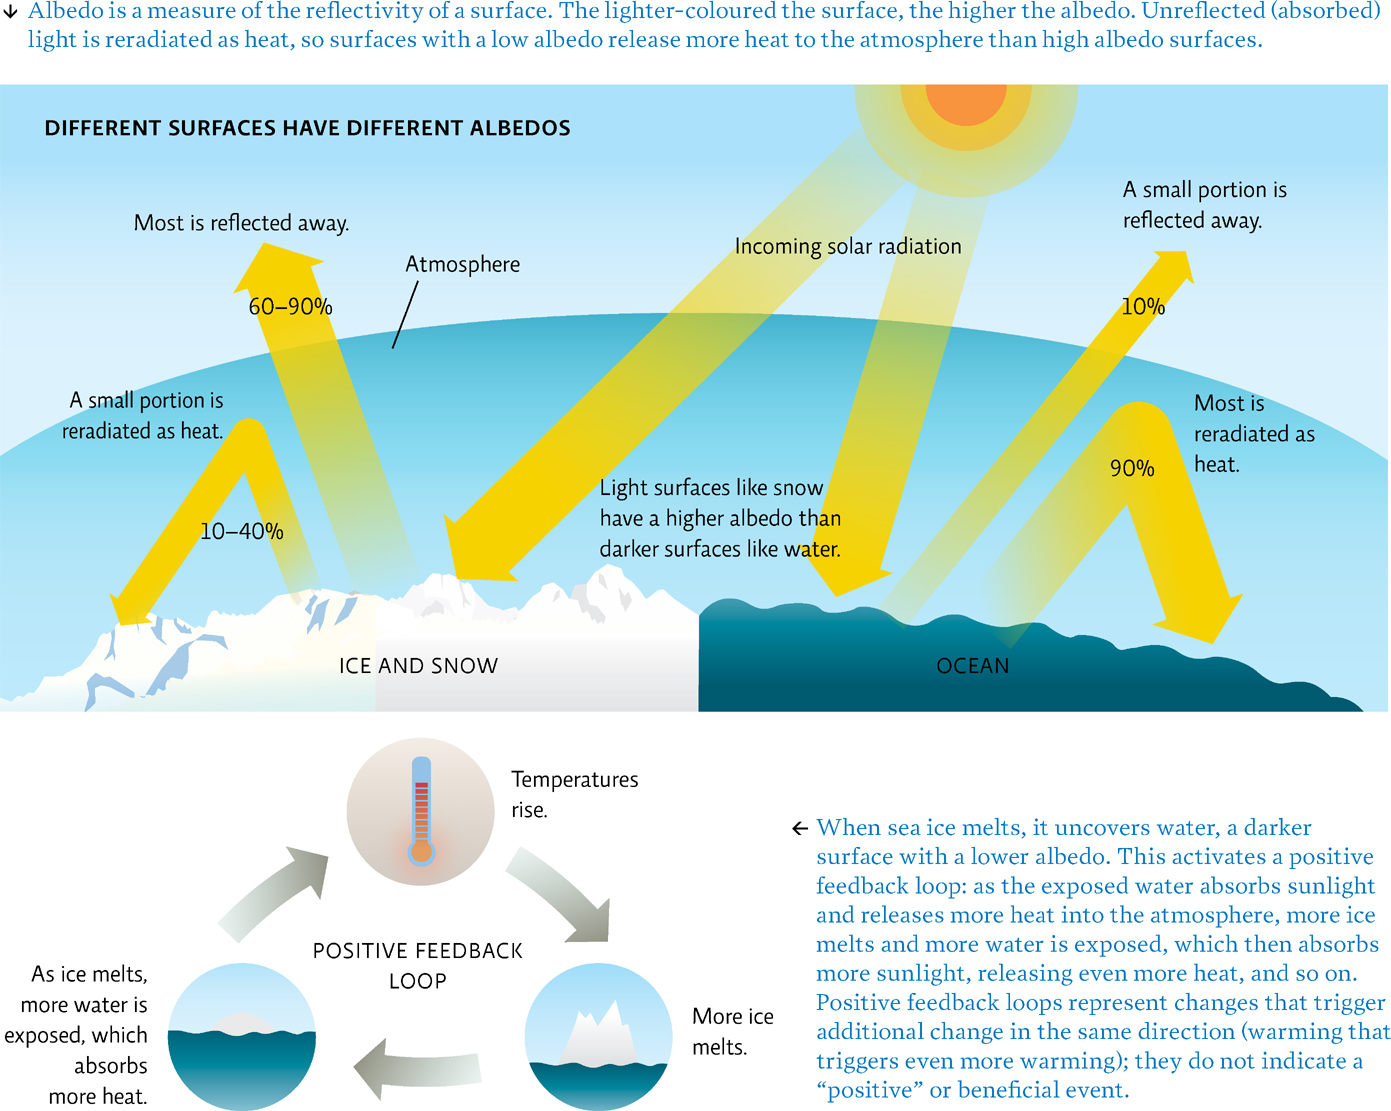
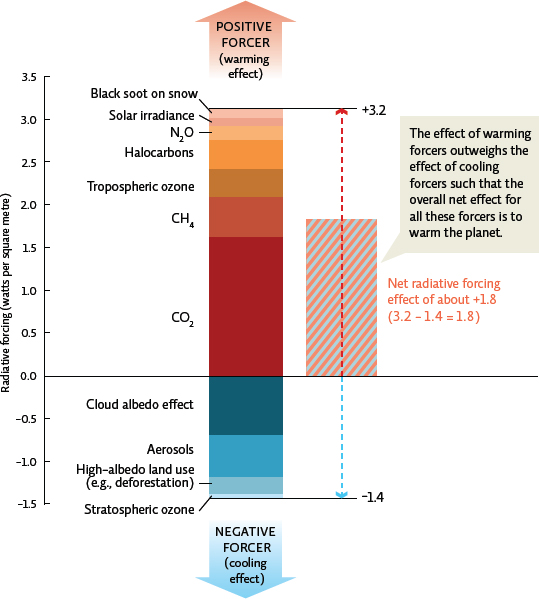
Greenhouse gases are just one type of radiative forcer, or factor that can affect global climate. Another kind of forcer that plays a role in present warming trends is albedo, the ability of a surface to reflect away solar radiation. Light-coloured surfaces, like glaciers and meadows, have a high albedo—they reflect sunlight, and thus heat, away from the planet’s surface. Darker surfaces, like water and dark asphalt, have low albedo—they absorb sunlight, and heat along with it, and then reradiate that heat back to the atmosphere. As surfaces with high albedo are replaced by those with low albedo, not only does the planet warm, but a positive feedback loop can be triggered.
Glaciers are a good example of positive feedback: as temperatures rise, glaciers melt and ice (high albedo) gives way to water (low albedo). Because this new watery surface absorbs more heat than the old icy surface, the region warms even faster—replacing even more ice with water, and so on. Canada may lose 1/5th of its ice sheet by 2100. The Canadian ice sheet is the 3rd largest in the world, after Antarctica and Greenland, and this melting alone could raise sea levels 3.5 centimetres. [infographic 22.4]
399
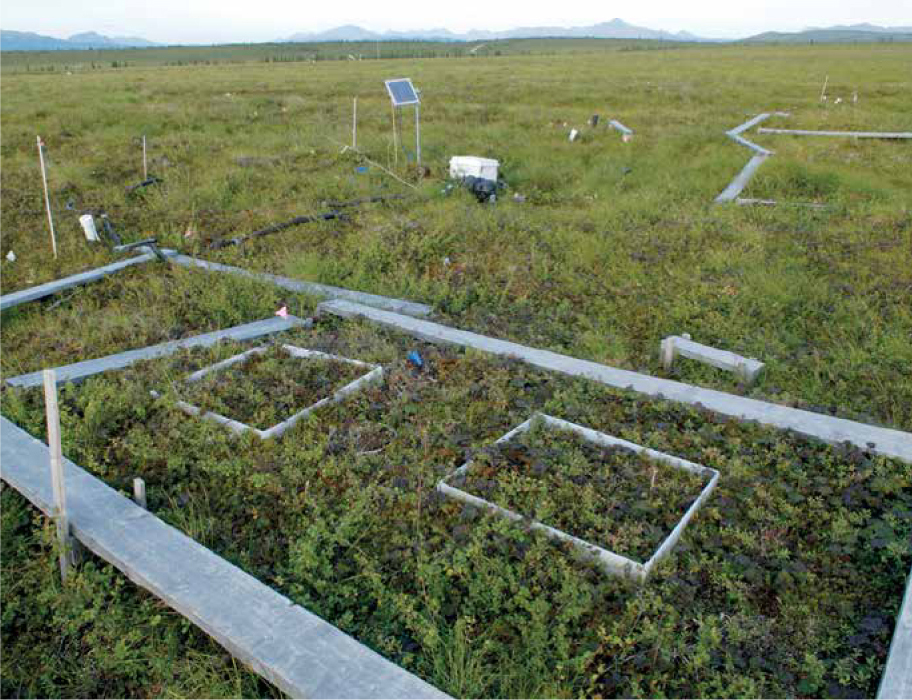
There are other positive feedback loops, too. In the Arctic, for example, the upper levels of permafrost (land that normally remains frozen year-round) are melting during the summer months. When these areas thaw, they release stored carbon, adding more greenhouse gases to the atmosphere. These gases warm the area further, causing even more permafrost melt. This is very significant in Canada, where half of the landmass is permafrost.
There are also other natural forcers, including clouds. Some have a high albedo and thus work to cool the planet; others trap reradiated heat from the planet’s surface and thus have a warming effect. If warming temperatures cause the formation of more of the high-albedo clouds, this could trigger cooling—a negative feedback loop. Right now, clouds have a net cooling effect; whether this trend will continue in the future remains to be seen. [infographic 22.5]
400
401
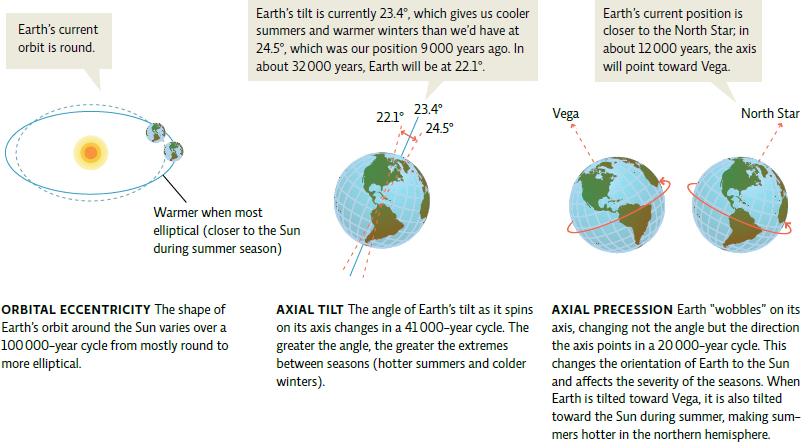
Volcanic eruptions and changes in solar irradiance (like sunspot cycles) are also considered natural forcers, as both have been known to impact climate in the past, though only over short time frames and not as severely as greenhouse gases. Scientists also believe that Milankovitch cycles (predictable long-term cycles of Earth’s position relative to the Sun) played an important role in earlier climate change events. [infographic 22.6]
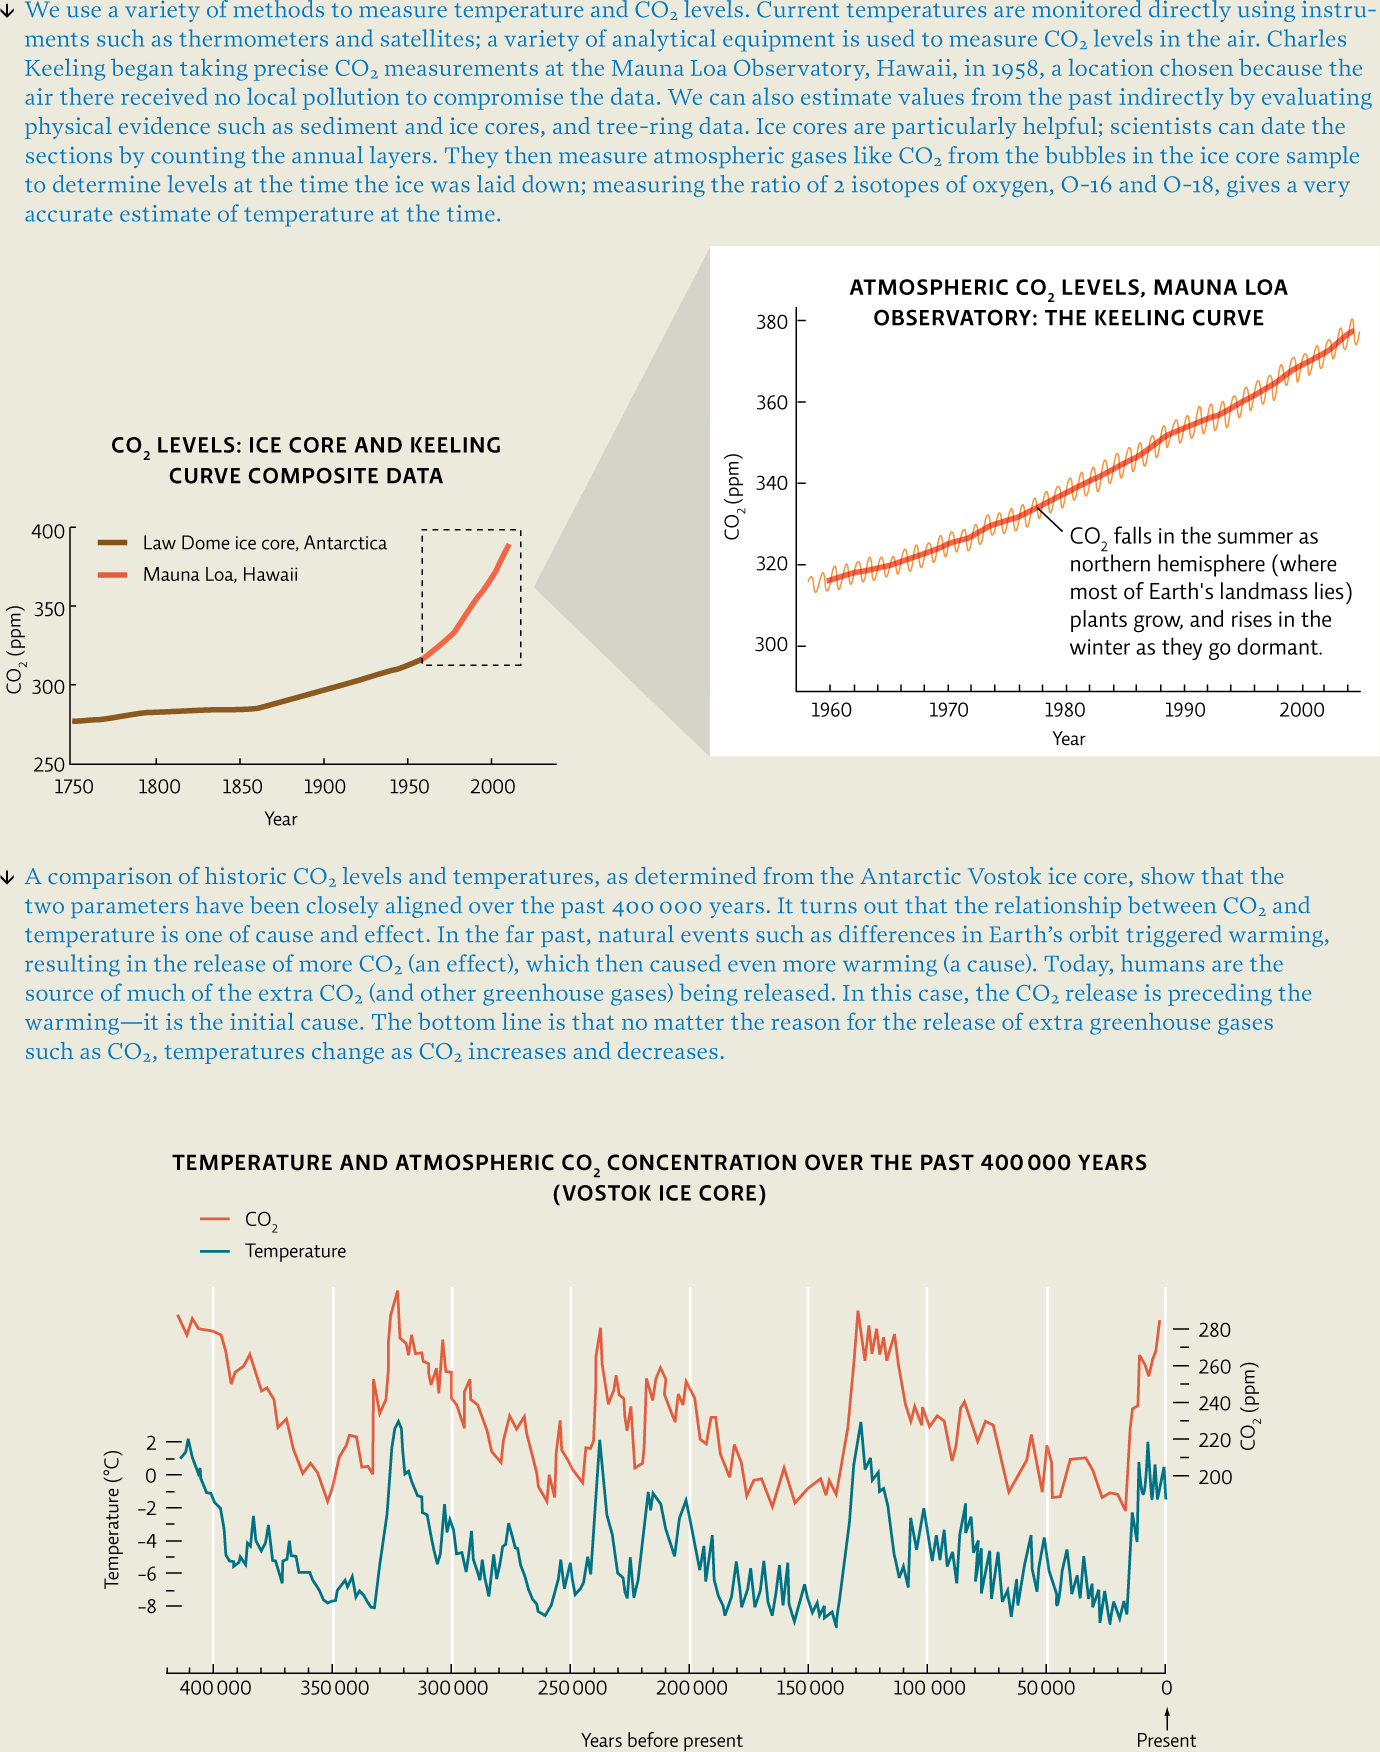
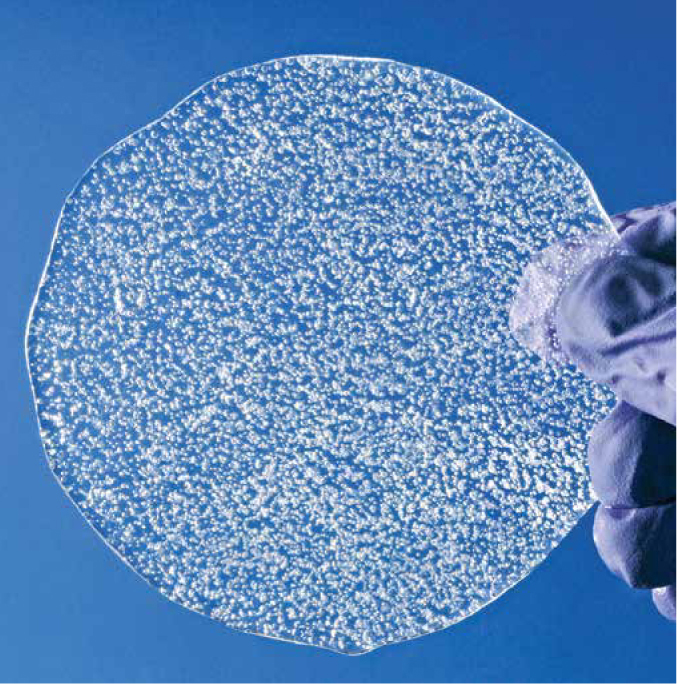
To figure out how much any given forcer or feedback loop is contributing to current warming, or to guess at what future climate might look like based on what we are seeing now, climate scientists must do more than monitor current atmospheric conditions; they must also gather data (on temperature, CO2 levels, etc.) from the distant past. They do this by studying a wide variety of clues that have been left behind—ice and sediment cores, tree rings, coral reef growth layers, even fossilized mud at the bottom of lakes and rivers (see Chapter 1). These various sources have consistently corroborated one another: ice cores paint the same picture as tree rings, and coral reef layers confirm what pollen sediments tell us. This consistency enables us to trust their overall story. [infographic 22.7]
Climate scientists have used this wealth of historical data to develop what they call climate models—computer programs that allow them to make future climate projections by plugging in all the current values (for temperature, CO2, global air circulation patterns, etc.). These models are used to see how altering the value of certain parameters (say, increasing the amount of atmospheric CO2) might impact future climate. It may seem ironic that climatologists can predict what the climate will be like 100 years from now, when meteorologists often have a hard time getting the weekly weather forecast right. But scientists say that climate is actually easier to predict than weather. Climate refers to general trends, while weather is much more specific; it is more like a close-up view rather than a view from afar.
402
403
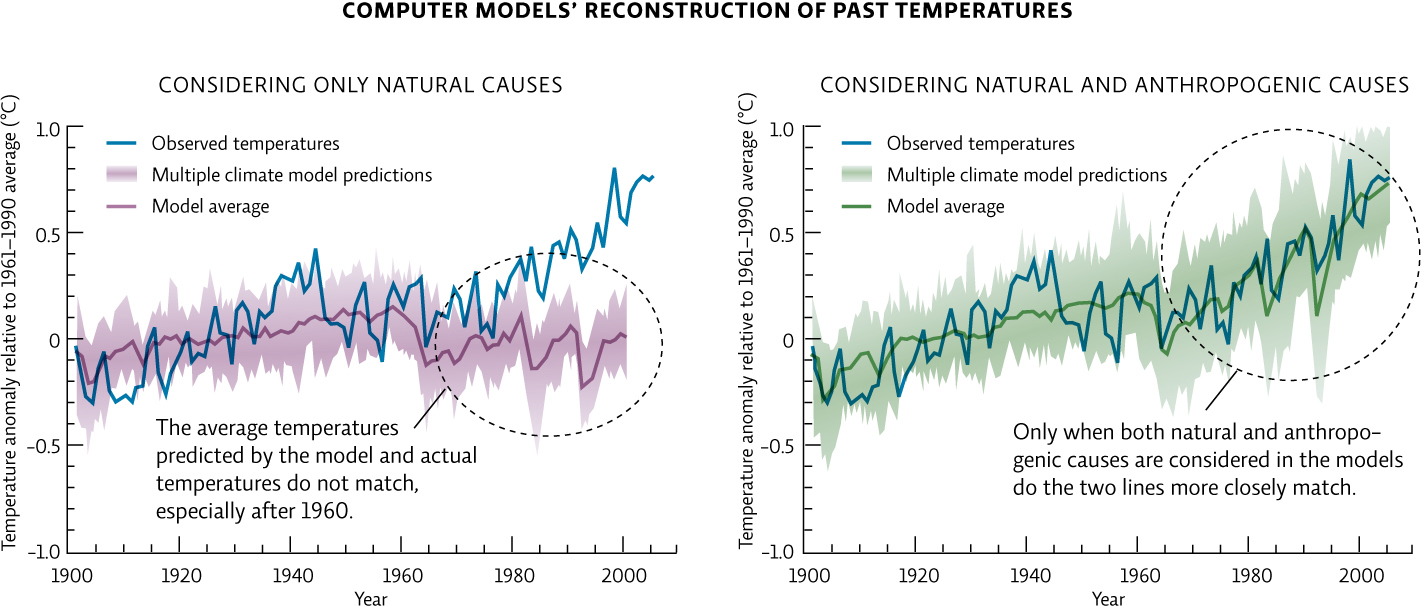
Based on all the clues they have gathered and analyzed, scientists agree that all the natural forcers combined are not enough to account for the rapid climate change that is currently underway. Only when we consider both natural and anthropogenic (related to human actions) forcers together do current trends make sense. [infographic 22.8]
