2.5 Different types of studies amass a body of evidence.
Solomon’s hypothesis generated the prediction that the stratosphere would contain high levels of chlorine monoxide, or ClO. If polar clouds and sunlight were causing chlorine to react with ozone, then the atmosphere should contain many molecules of chlorine bound to individual oxygen atoms. This prediction was falsifiable, since Solomon might not find high levels of ClO.
28
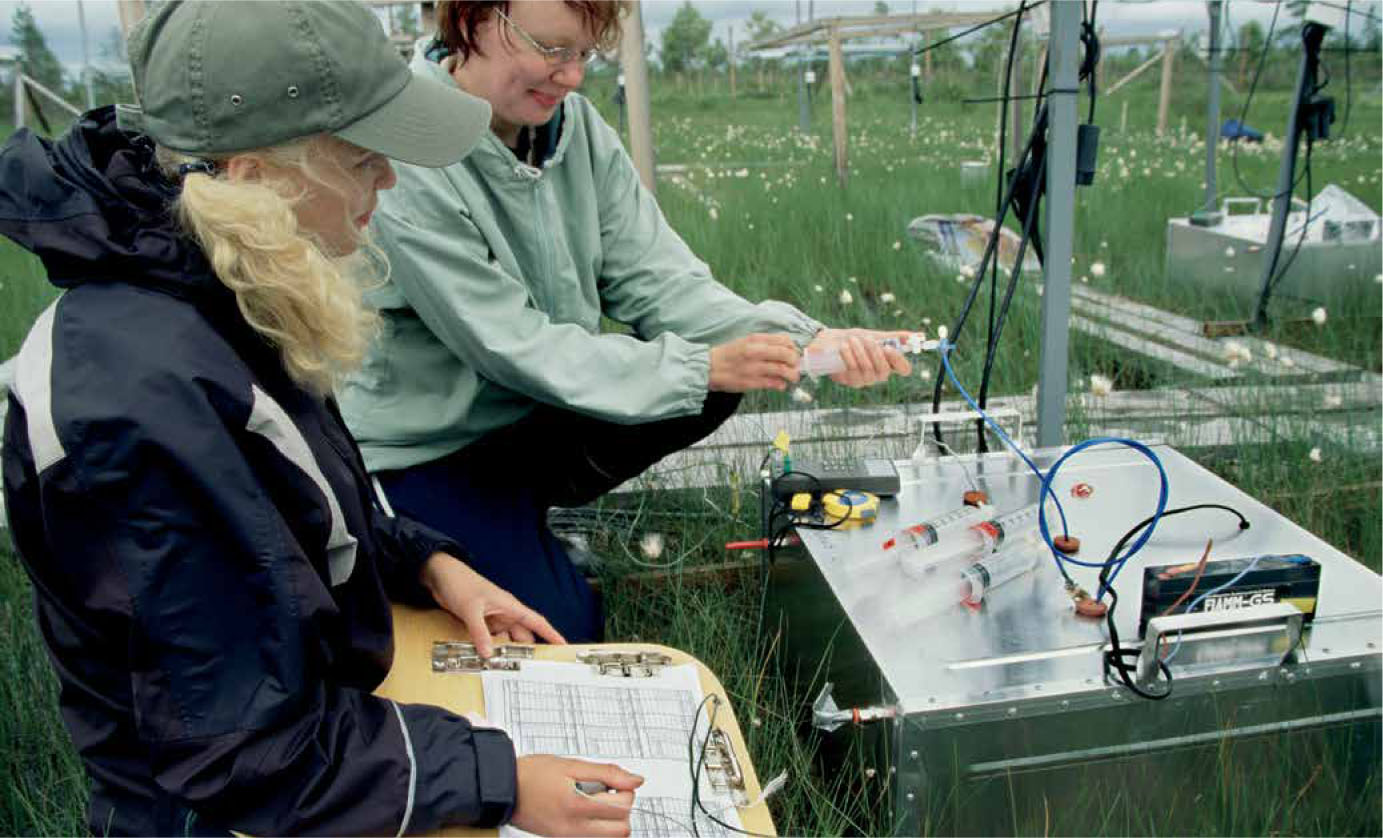
On both of her trips to the Antarctic, her team raised balloons into the air which measured the composition of the atmosphere where the ozone hole was found, and simultaneously analyzed light reaching the ground to determine whether it was changing in the region with less ozone and more ClO. They came back with measurements of ClO that would turn out to be their so-called smoking gun.
At the time, NASA ozone-modeller Paul Newman believed the loss of ozone in the Antarctic spring was due to excess solar activity. But when the ClO measurements from Solomon’s team streamed out of a fax machine in NASA’s Goddard Research Center, he knew the evidence supported Solomon’s polar cloud hypothesis. [infographic 2.4]
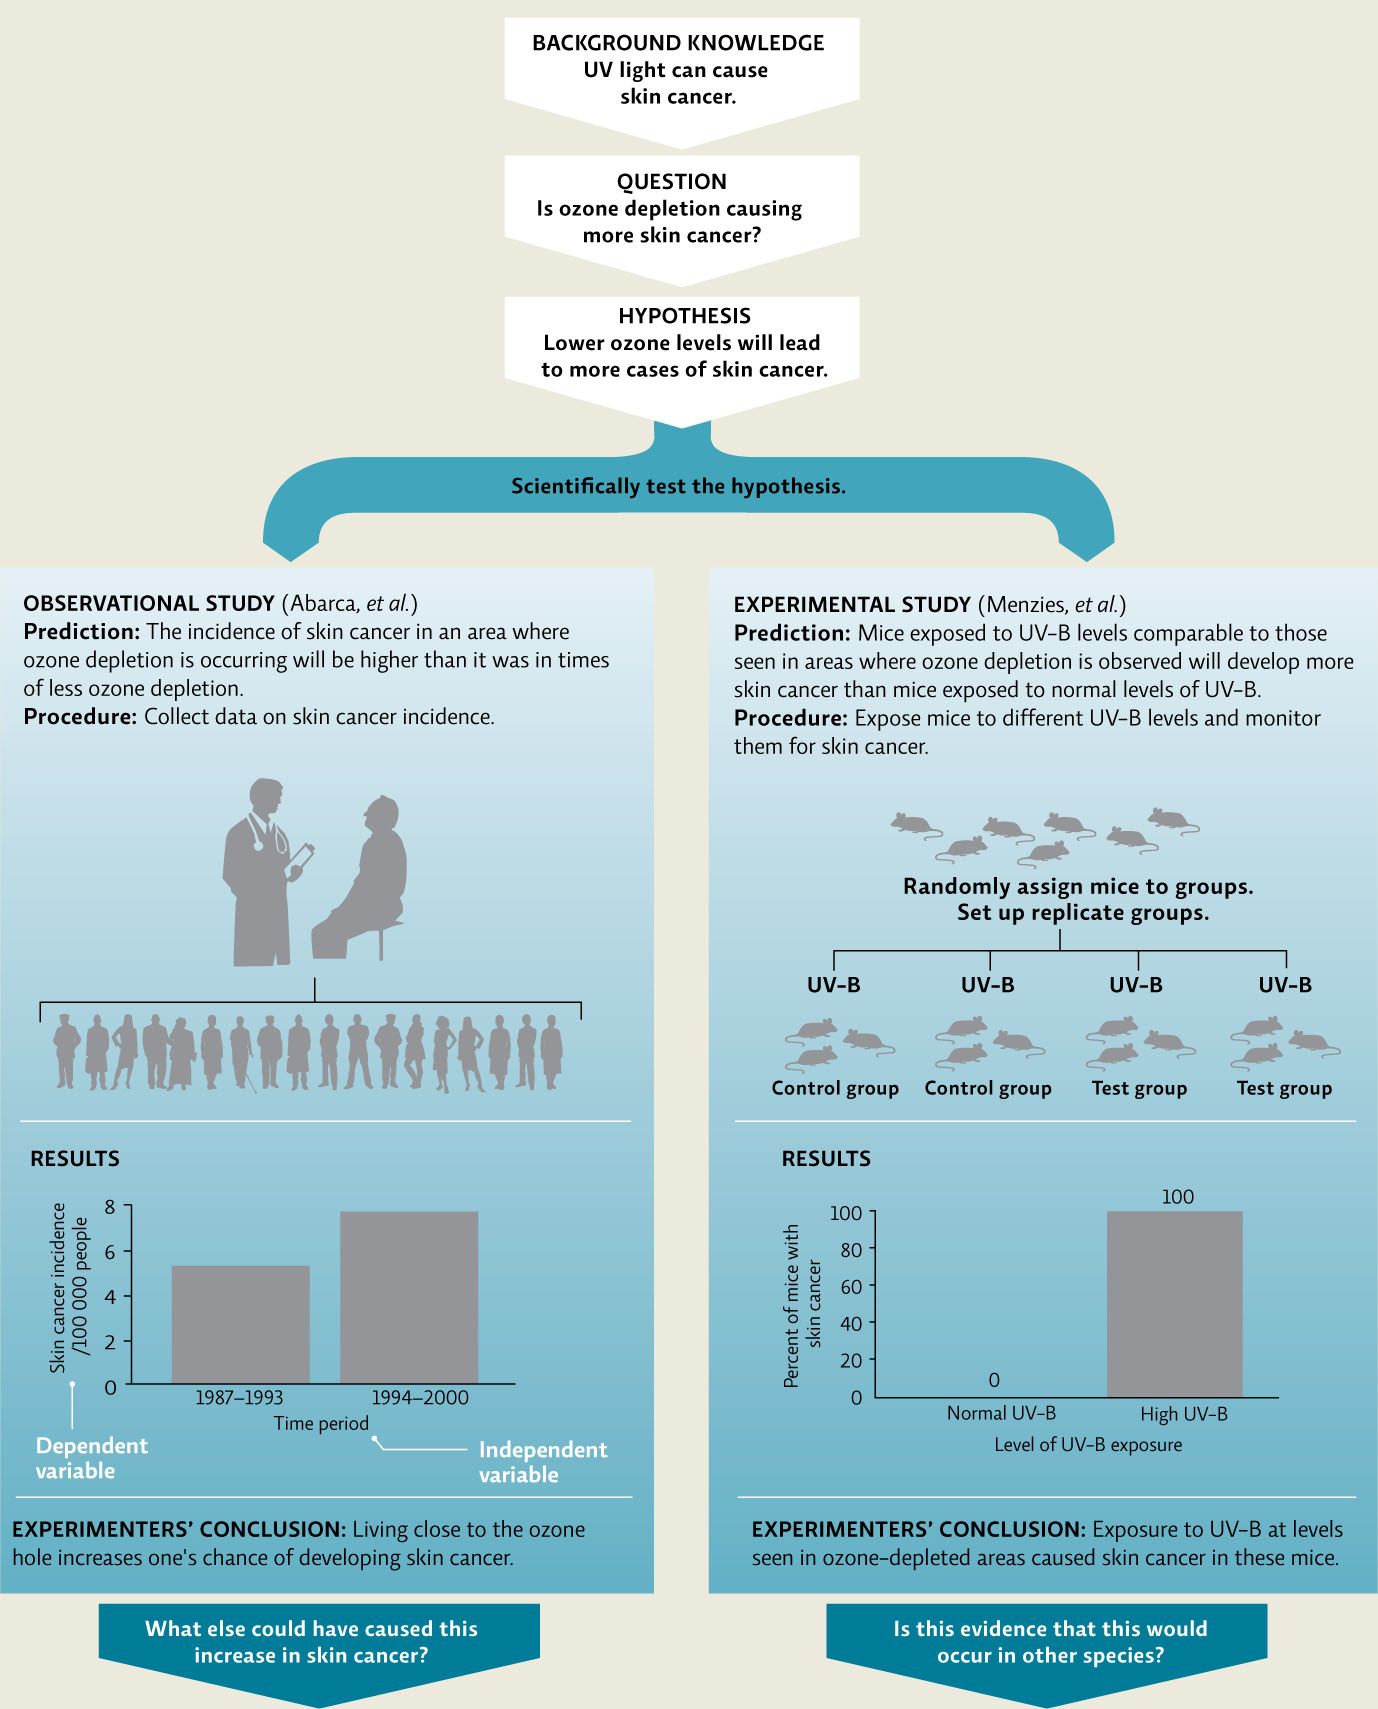
Solomon’s experiment is an example of an observational study—collecting data in the real world without intentionally manipulating the subject of study. In these types of studies, researchers may simply be gathering data to learn about a system or phenomenon, or they may be comparing different groups or conditions found in nature. Often, researchers can conduct observational studies that take advantage of natural changes in the environment such as collecting “before and after” data in an area to examine the effect of a natural perturbation such as a flood or volcanic eruption, or in this case comparing areas with different levels of ozone depletion. These types of opportunities represent valuable “natural experiments” that can allow us to test cause-and-effect hypotheses, just as a controlled experimental study, in which the researcher intentionally manipulates the conditions of the experiment in a lab or field setting, allows us to do. For instance, much research is underway on the effects on living organisms of ozone depletion and elevated UV exposures. Previous studies have shown that UV exposure can increase the incidence of skin cancer. A reasonable question would be: is ozone depletion causing more skin cancer? This could be used to generate an experimental hypothesis such as: lower ozone levels will lead to more cases of skin cancer. This hypothesis generates many predictions; some would be tested with observational studies and others experimentally.
29
In 2002, Chilean researchers Jaime Abarca and Claudio Casiccia investigated this hypothesis by evaluating skin cancer incidence in residents of Punta Arenas, Chile, a region exposed to higher UV-B due to its proximity to the ozone hole. Because of the ozone hole, global air circulation patterns have actually shifted; the southern hemisphere jet stream now circulates at a latitude closer to the South Pole, taking the ozone-depleted air over the more populated regions of the Southern Hemisphere like southern Chile. They predicted that more cases of skin cancer would be seen there in years when ozone depletion was high. To test this they calculated skin cancer rates of the population between 1987 and 1993, and compared those to rates from the same population between 1994 and 2000. The results of their study showed that nonmelanoma skin cancer rates were significantly higher in times when ozone depletion was higher. This evidence supports their hypothesis and correlates living close to the Antarctic ozone hole with one’s chance of developing skin cancer. This observational study does not manipulate any variable—no people were exposed to higher or lower levels of UV-B or intentionally relocated to areas of higher or lower ozone depletion. The researchers simply collected data that was available in the population and then evaluated it to see if the two variables—ozone depletion and skin cancer incidence—were correlated.
30
We can’t ethically manipulate people to further test this hypothesis but we can conduct an experimental study on cells or model organisms such as mice. Australian researcher Scott Menzies and his colleagues did just that in the early 1990s by testing the prediction that mice exposed to high UV-B would develop more skin cancer than mice exposed to normal levels of UV-B. This experiment compared two groups—the control group of mice was exposed to normal levels of UV-B and the test group was exposed to the same amount of UV-B received in areas where ozone depletion has been observed. The two groups are identical in every way except for the test variable (in this case, the amount of UV-B radiation exposure). The inclusion of a control group is key because it allows researchers to attribute any differences seen between the two groups to the single test variable that was altered. If researchers only looked at the test group, they would have no way to determine whether the incidence of skin cancer was higher than normal.
In an experimental study, we have both an independent variable and a dependent variable. We manipulate the independent variable (in this case, the amount of UV-B radiation), and measure the dependent variable (the incidence of skin cancer) to see if it is affected. In other words, if development of skin cancer is dependent on UV-B radiation, then we should see skin cancer incidence change as UV-B exposure changes. Scientists often represent their data on a graph, on which the x-axis (horizontal axis) displays the independent variable and the y-axis (vertical axis) shows the response (dependent variable). Menzies’ data showed a clear difference between his control group (none developed skin cancer) and his test group (100% developed skin cancer). It is rare to see such an absolute difference and, as with any study, we would like to see these results replicated, but a well-designed and well-conducted study increases our confidence that the results are valid. [infographic 2.5]
Both observational and experimental studies gather data systematically to produce scientifically valid evidence. In contrast, anecdotal accounts (individual occurrences or observations) represent data that was not systematically collected or tested and cannot be compared to any control (many uncontrolled variables exist). While anecdotes are not considered acceptable scientific evidence, a claim based on anecdotal accounts could be tested to see if a correlation or cause-and-effect relationship exists.
Solomon and her team reported their evidence to the international scientific community by publishing their results in Nature and the Journal of Geophysical Research in 1987. These are peer-reviewed journals—meaning that before results are published, they are reviewed by a group of outside experts. Studies that are not well-designed or well-conducted are not accepted for publication. Therefore, peer-reviewed published research represents high-quality scholarship in the field. In this case, the reviewers already knew that CFCs were present in the stratosphere, and lab studies showed they were capable of destroying ozone. Now, Solomon and her team were presenting evidence that, at the time of year when ozone was dropping, the Antarctic stratosphere contained high levels of ClO, demonstrating that free chlorine atoms were reacting with ozone.
The evidence was amassing that CFCs were contributing to ozone depletion, but that didn’t mean the other hypotheses would be immediately abandoned. Research on these alternative hypotheses continued but scientists were not finding evidence to support the other hypotheses’ predictions. If lower, ozone-poor air was lifting and mixing with the stratosphere, then researchers should observe gases moving upward in the atmosphere; instead, they saw the opposite: air seemed to be flowing downward. If solar activity was creating nitrogen oxides (NOx) that were destroying ozone, as NASA modeller Paul Newman had once believed, then scientists should have observed increases in NOx in the South Pole. But when they took measurements, they found that NOx levels were actually decreasing. This observation provided further support for Solomon’s hypothesis, which predicted that NOx levels should be low, not high—because otherwise NOx would combine with ClO molecules and prevent them from interacting with ozone.
The multiple lines of evidence are so compelling that they have elevated the “CFC hypothesis” to the status of theory—a widely accepted explanation that has been extensively and rigorously tested. (But just like well-supported hypotheses, we do not claim that a theory is proven. Even well-substantiated theories are always open to further study.) This differs from the casual meaning of theory, which suggests a speculative idea without much substance. To discount any scientific theory as “just a theory” represents a serious flaw in one’s understanding of what a scientific theory really is.
31
32
As mentioned earlier, in science there are degrees of certainty; we know some things better than others. The more evidence we have in support of an idea, especially from different types of experiments, the more certain we are that we are on the right track. These degrees of certainty are expressed mathematically in terms of probabilities using statistics. A mathematical analysis of the data is done to determine the probability that the occurrence of a phenomenon (in this case the experiment’s result) is a random event, rather than being caused by the variable being investigated.
This type of analysis of the data allows us to quantitatively assign a level of certainty to our conclusions. In statistics, this probability is expressed as a p-value that represents the likelihood our conclusions are wrong. Scientists generally require a high probability (at least 95%) that their conclusions are correct (p ≤ 0.05 represents a level of certainty of 95%). This means that there is only a 5% chance we have incorrectly accepted or rejected our hypothesis. The more evidence that accumulates in favour of a particular conclusion, the more certain we are that it is likely to be correct and can be used to inform our decisions. Just because we don’t know exactly what will happen if we continue to release CFCs into the atmosphere (including how fast the ozone layer will deplete, or when it could jeopardize human health) doesn’t mean we don’t know enough to take action. [For more on statistics and experimental design, see Appendix 3.]
Indeed, the loss of ozone was starting to have the effects that the studies in Chile and Australia were showing. Other observational studies revealed that UV-B levels were increasing in high- and midlatitude regions. Research by NASA scientists showed that the amount of UV-B reaching the ground in the midlatitudes in the mid-1990s had increased over 1979 levels. Other research showed that UV-B levels were 45% higher than normal in the spring of 1990 at the southern tip of Argentina.
In the meantime, skin cancer incidence has increased in human populations (as have other skin disorders and eye problems such as cataracts) and other organisms are also affected by extra UV-B exposure. Photosynthesis rates in marine organisms such as the tiny phytoplankton of the Antarctic sea are lower than normal in the spring because of increased UV-B exposure—a troublesome fact since phytoplankton forms the base of the Antarctic food chain. Decreases in photosynthesis are also troubling because they could lead to lower agricultural productivity and reduce the value of these areas as “carbon sinks”—areas where carbon is stored, keeping it out of the atmosphere (see Chapter 22 on climate change).