The center and variability of a density curve
Density curves help us better understand our measures of center and variability. The median and quartiles are easy. Areas under a density curve represent proportions of the total number of observations. The median is the point with half the observations on either side. So, the median of a density curve is the equal-areas point, the point with half the area under the curve to its left and the remaining half of the area to its right. The quartiles divide the area under the curve into quarters. One-fourth of the area under the curve is to the left of the first quartile, and three-fourths of the area is to the left of the third quartile. You can roughly locate the median and quartiles of any density curve by eye by dividing the area under the curve into four equal parts.
297
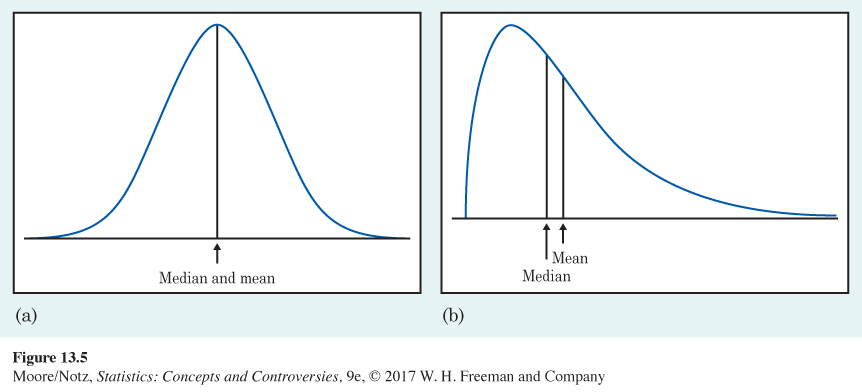
Because density curves are idealized patterns, a symmetric density curve is exactly symmetric. The median of a symmetric density curve is, therefore, at its center. Figure 13.5(a) shows the median of a symmetric curve. We can roughly locate the equal-areas point on a skewed curve like that in Figure 13.5(b) by eye.
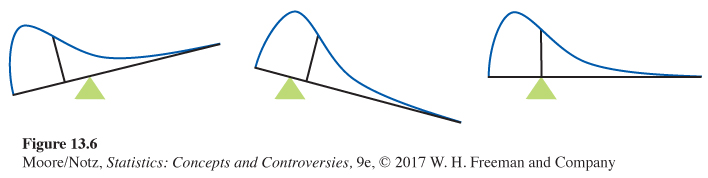
What about the mean? The mean of a set of observations is their arithmetic average. If we think of the observations as weights stacked on a seesaw, the mean is the point at which the seesaw would balance. This fact is also true of density curves. The mean is the point at which the curve would balance if made of solid material. Figure 13.6 illustrates this fact about the mean. A symmetric curve balances at its center because the two sides are identical. The mean and median of a symmetric density curve are equal, as in Figure 13.5(a). We know that the mean of a skewed distribution is pulled toward the long tail. Figure 13.5(b) shows how the mean of a skewed density curve is pulled toward the long tail more than is the median.
298
Median and mean of a density curve
The median of a density curve is the equal-areas point, the point that divides the area under the curve in half.
The mean of a density curve is the balance point, or center of gravity, at which the curve would balance if made of solid material.
The median and mean are the same for a symmetric density curve. They both lie at the center of the curve. The mean of a skewed curve is pulled away from the median in the direction of the long tail.