CHECK THE BASICS
ex11-01
For Exercise 11.1, see page 246; for Exercise 11.2, see page 252.
Question 11.3
11.3 Histograms. Use a histogram when
(a) the number of observations is small.
(b) you want to look at the distribution of a quantitative variable.
(c) you want to look at the distribution of a categorical variable.
(d) you want to show the actual observations.
Question 11.4
11.4 Histograms. The heights of the bars on a relative frequency histogram displaying the lengths of rivers will add to
(a) 100%.
(b) the sample size.
(c) the sum of all the river lengths.
(d) the midpoint of the distribution.
Question 11.5
11.5 Stemplots. An advantage of a stemplot over a histogram is
(a) they are good for really large data sets.
(b) they are horizontal.
(c) one can recover the actual observations from the display.
(d) the classes are chosen for you.
Question 11.6
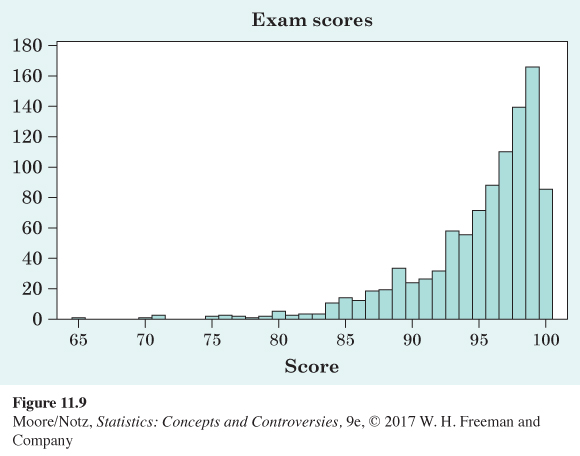
11.6 Shape of distributions. Figure 11.9 contains exam scores for 500 students. What is the shape of the exam score distribution?
(a) symmetric
(b) skewed right
(c) skewed left
(d) none of the above
Question 11.7
11.7 Shape of distributions. In a certain town, most haircuts are between $10 and $20, but a few salons cater to high-end clients and charge $30 to $60. The distribution of haircut prices is
(a) symmetric.
(b) skewed right.
(c) skewed left.
(d) none of the above.
258